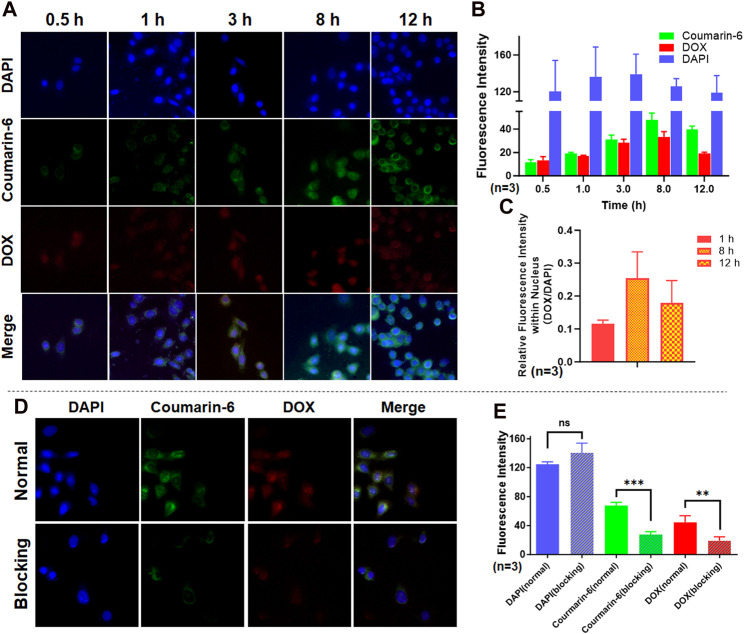
FIGURE 5.
Cell internalization and affinity test results of SCP NPs. (A) The fluorescence signal accumulation after SCP NPs were endocytosed by SW48 cells; (B) The quantitative results of three fluorescence signals in cells (n = 3); (C) The comparison of relative fluorescence intensity of DOX and DAPI in the nucleus during the experiment (n = 3); (D) The fluorescence microscope images of SCP NPs internalization in SW48 cells after endocytosis was inhibited by NaN3; (E) The comparison of three fluorescence signal intensities (n = 3). In terms of statistically significant differences, non-significant differences are marked as ns, p < 0.01 is marked as **, and p < 0.001 is marked as ***.

