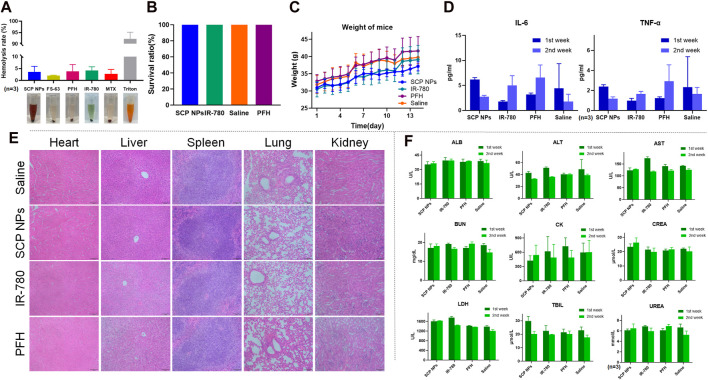
FIGURE 6.
Biocompatibility test results of SCP NPs. (A) The hemolytic test of SCP NPs and its main components (n = 3); (B) The survival rate of mice in each group in the acute toxicity test; (C) The average body weight change curve of mice in each group in the acute toxicity test; (D) The concentrations of inflammatory factors TNF-α and IL-6 in mice blood in each group during the first and second weeks of acute toxicity test (n = 3); (E) The HE staining results of the main organ tissues of mice in each group during the first week of acute toxicity test; (F) The main blood biochemical indicators of mice in each group in the first and second weeks of acute toxicity test (n = 3).

