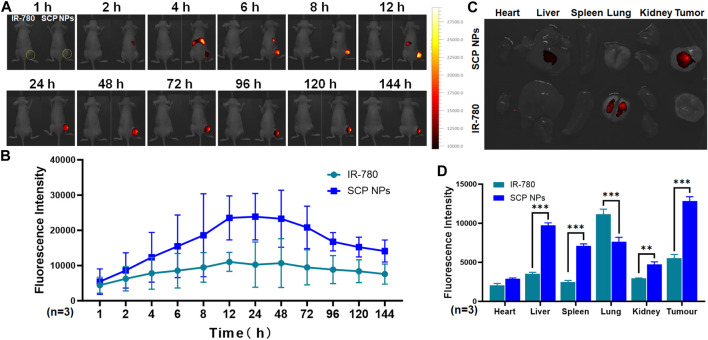
FIGURE 7.
In vivo distribution and targeted delivery performance of SCP NPs in SW48 mouse subcutaneous tumor model. (A) The fluorescence signal distribution of SCP NPs in mice. At each time point, the left and right mice were injected with IR-780 and SCP NPs, respectively. The yellow dotted line marks the tumor area; (B) The quantitative analysis of fluorescence signals in the tumor area (n = 3); (C) The residual fluorescence signals distribution of major organs and tumor of mice; (D) The quantitative analysis of fluorescence signal intensity of major organs and tumor of mice (n = 3).

