FIGURE 9.
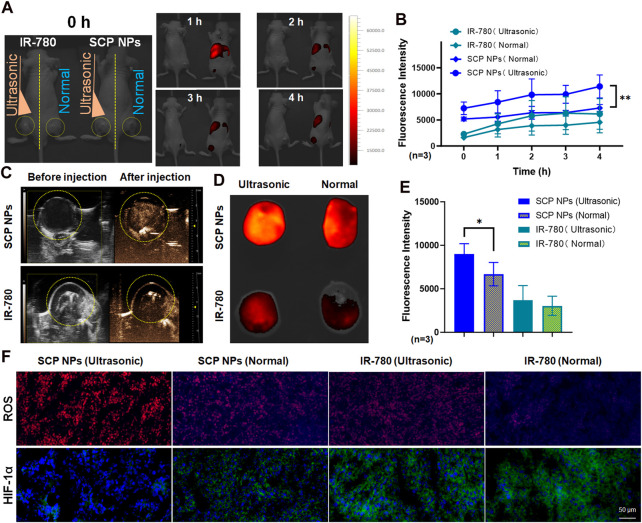
In vivo ultrasound triggering and SDT test results of SCP NPs. (A) The fluorescence signal distribution in mice after SCP NPs were triggered by ultrasound. The left and right mice were injected with IR-780 and SCP NPs, respectively. The left tumors were treated with ultrasound. The right tumors are non-triggered. The yellow dotted line marks the tumor area; (B) The quantitative analysis results of fluorescence signals in the tumor areas (n = 3); (C) The ultrasonic imaging results of the SCP NPs and IR-780 injected mice with ultrasound triggering one side of the tumors, the yellow dotted line marks the tumor area; (D) The distribution of retained fluorescence signal in the tumors; (E) The quantitative analysis of fluorescence signal intensity in the tumors (n = 3); (F) The fluorescence images of ROS generation levels and immunohistochemical analysis results of HIF-1α of the tumor in different treatment groups of mice. In ROS detection, DHE exhibits weak blue fluorescence, while its reaction products with ROS emit strong red fluorescence. In HIF-1α immunohistochemical staining, cell nuclei are labeled with blue fluorescence from DAPI, whereas HIF-1α is marked with green fluorescence by antibodies. In terms of statistically significant differences, p < 0.05 is marked as * and p < 0.01 is marked as **.

