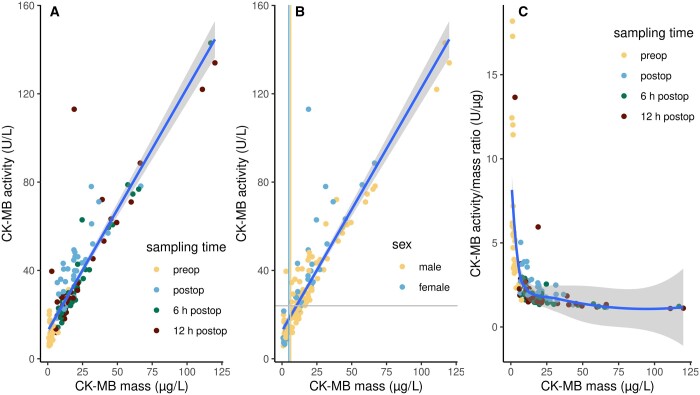
Figure 1:
Scatter plots of CK-MB levels measured as activity, mass concentration, and their ratio in 152 serum samples of 38 patients. (A) CK-MB activity vs mass. Colour indicates sampling time. (B) CK-MB activity vs mass. Colour indicates sex. The straight blue lines in (A) and (B) represent the OLS linear regression with the 95% confidence interval in dark grey. The light grey horizontal line indicates the 99th percentile of CK-MB activity in healthy subjects. The yellow and blue vertical lines indicate the 99th percentiles of CK-MB masses of male and female healthy subjects, respectively. (C) CK-MB activity/mass ratios vs mass. Colour indicates sampling time. The blue line is a locally estimated scatterplot smoothing non-parametric regression with the 95% confidence interval displayed in grey.

