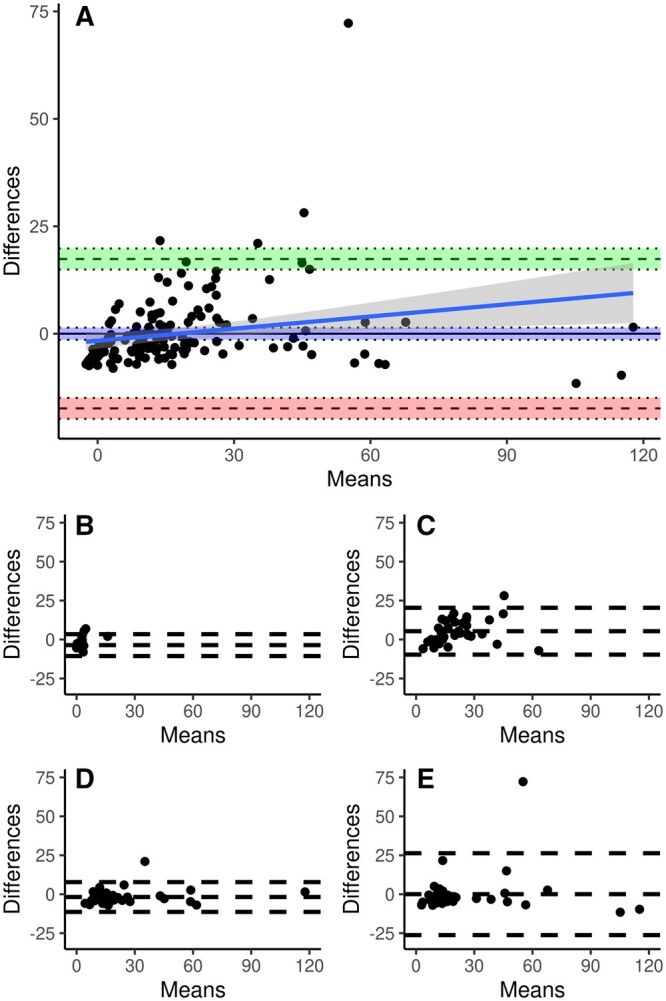
Figure 2:

Bland–Altman plots comparing measured CK-MB masses and masses predicted from CK-MB activities with an OLS linear regression. Each panel shows a plot of the differences between measured and predicted masses against their mean. (A) All samples (n = 152). The areas between the pairs of dotted lines indicate the 95% confidence intervals around the upper limit of agreement (green), the mean difference (blue) and the lower limit of agreement (red). The blue line is the linear regression of differences and means with the 95% confidence interval in dark grey. (B) Preoperative samples (n = 38). (C) Immediately postoperative samples (n = 38). (D) 6 h postoperative samples (n = 38). (E) 12 h postoperative samples (n = 38).
