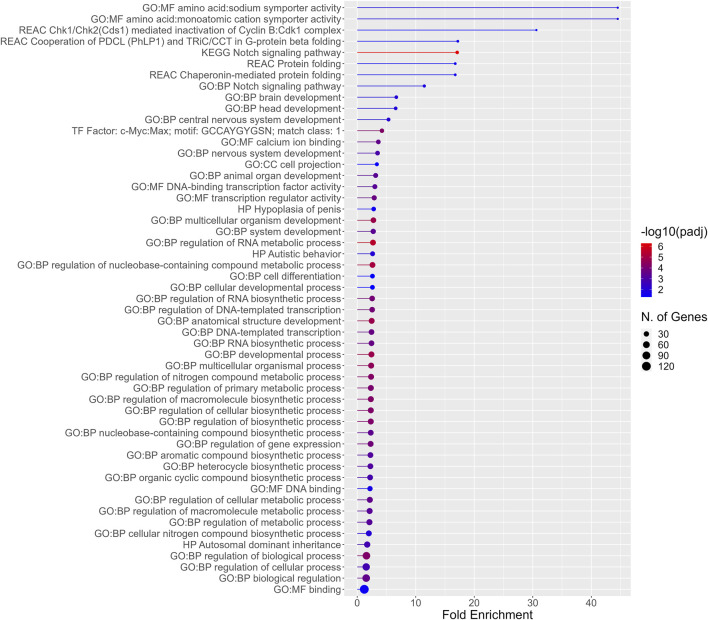
FIGURE 5.
Functional enrichment for the 192 DEGs common among all PFAS 8–13. Higher fold enrichment is represented by bars that extend farther across the x-axis, a larger number of DEGS from the present dataset associated with a given process is signified by a larger dot (N. of Genes), and increasing significance of the enrichment is shown as the color of the dots approaches red (−log10padj).

