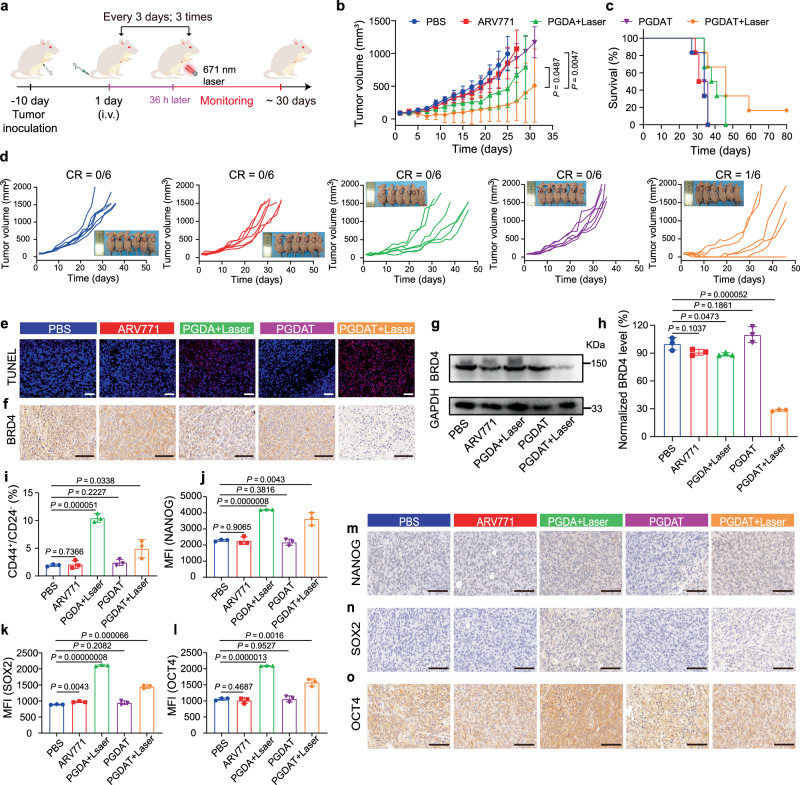
Fig. 4. Antitumor performance of the ROS-activatable PROTAC nanoparticle in MDA-MB-231 breast tumor model in vivo.
a Experimental schedule of the ROS-responsive PROTAC nanoparticles for antitumor study. b Tumor growth curves of the tumor-bearing mice subjected to different treatments (n = 6 mice), the statistical analysis was based on the two-sided unpaired t-test. c Survival plots of the tumor-bearing mice (n = 6 mice). d Individual tumor growth graph after being treated with various formulations, insert was photograph of tumor-bearing mice at 27-days post treatment (n = 6 mice). e TUNEL (blue: DAPI, red: apoptotic cells) staining of the tumor sections at end of various treatments (scale bar = 100 μm). f IHC examination of BRD4 expression in the tumor tissues (scale bar = 100 μm). g Western blot analysis and (h) semi-quantitation of BRD4 expression in the tumor lysates (n = 3 mice). Statistical analysis was performed by two-sided unpaired t-test. i Flow cytometric assay of intratumoral cancer stem-like cells ratio (n = 3 mice). Statistical analysis was performed by two-sided unpaired t-test. Flow cytometric analysis of the NANOG (j), SOX2 (k), OCT4 (l) expression in the tumor site upon various treatments (n = 3 mice). Statistical analysis was performed by two-sided unpaired t-test. IHC assay of the NANOG (m), SOX2 (n), OCT4 (o) expression of the tumor sections (scale bar = 100 μm). All data are presented as mean ± SD.

