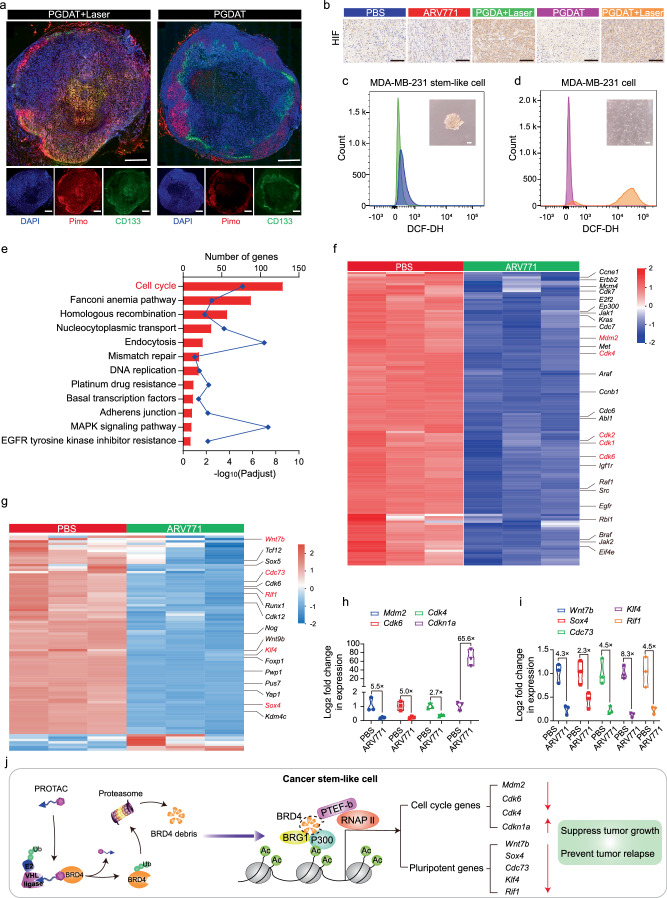
Fig. 5. BRD4 degradation influenced the gene expression of cancer stem-like MDA-MB-231 tumor cells in vitro.
a Immunofluorescence staining of tumor sections for hypoxia and cancer stem-like cells analysis (scale bar = 2.0 mm, the blue represents DAPI, the green represents CD133 and the red represents pimo). b IHC assay of HIF expression at tumor site after various treatments (scale bar = 100 μm). c, d Flow cytometry measurement of intracellular ROS level (insert: morphology image of different cells). e–g RNA-seq analysis of differential expression genes between MDA-MB-231 stem-like cells treated with PBS or ARV771 at the concentration of 1.0 μM for 24 h. e KEGG enrichment histogram of differentially expressed genes (statistical difference was calculated using two-sided Fisher’s exact test, n = 3 independent experimental cell lines), f heatmap of differentially expressed genes associated with cell cycle and (g) cell stemness (n = 3 independent experimental cell lines, red and blue colors represent upregulated or downregulated genes respectively). Quantitative PCR assay of the (h) cell cycle- and (i) cell stemness-related RNA levels in MDA-MB-231 CSCs post 24 h incubation with 1.0 μM of ARV771 (n = 3 independent experimental cell lines). j Schematic illustration of PROTAC-induced BRD4 degradation and thus influence the downstream genes. All data are presented as mean ± SD.

