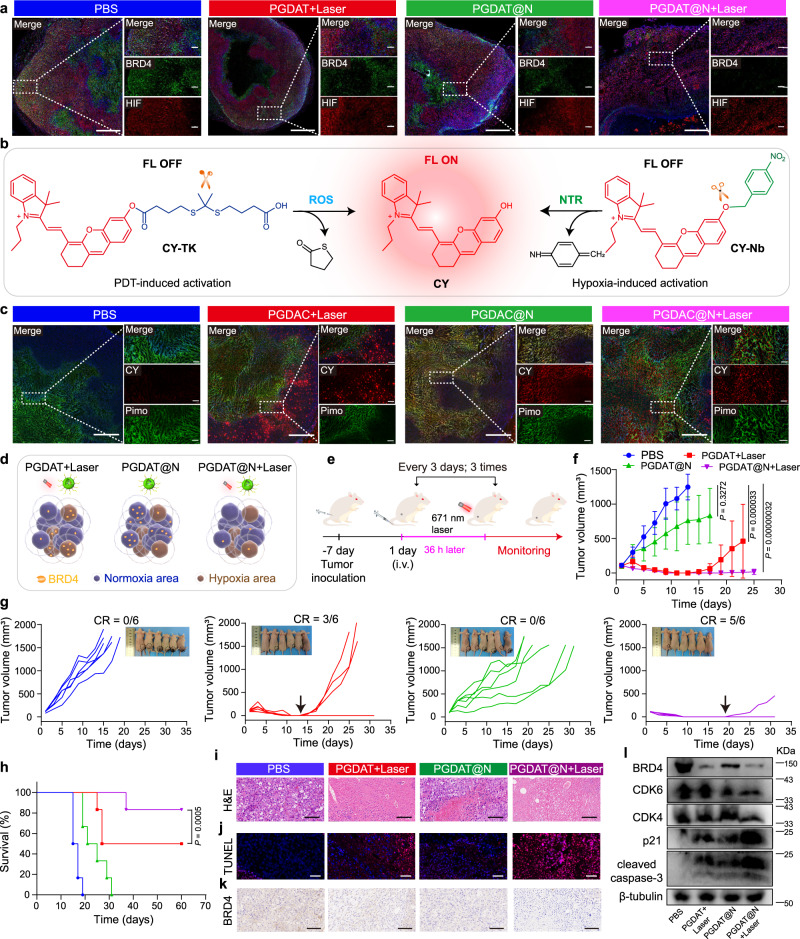
Fig. 7. Region-confined activation of the PROTAC nanoparticle and its antitumor property in HN30 HNSCC tumor model in vivo.
a IF staining of tumor sections for hypoxia (HIF) and BRD4 analysis after the tumor-bearing mice subjected to different treatments (left panel scale bar = 1.0 mm, right panel scale bar = 200 μm, the blue represents DAPI, the green represents BRD4 and the red represents HIF). b Schematic illustration of the ROS/NTR-triggered activation of CY from CY prodrugs. c Ex-vivo CLSM images of tumor sections post tumor-bearing mice subjected to various treatments for analysis of hypoxia (pimonidazole, pimo) and CY fluorescence (left panel scale bar = 1.0 mm, right panel scale bar = 200 μm, the blue represents DAPI, the green represents pimo and the red represents CY). d Cartoon illustration of region-confined activation of the nanoparticle and degradation of target protein BRD4. e Treatment schedule of the ROS/hypoxia-liable PROTAC nanoplatform antitumor study in HN30 tumor-bearing mice model. f–h PROTAC nanoparticle inhibited HN30 HNSCC tumor growth and relapse efficiently. Tumor growth curves (f) and individual tumor growth profiles (g) and survival plots (h) of the tumor-bearing mice upon treatment (n = 6 mice). Statistical analysis of f was performed by two-sided unpaired t-test. Statistical significance of h was calculated by survival curve comparison with Log-rank (Mantel-Cox) test. i H&E staining and j TUNEL (blue: DAPI, red: apoptotic cells) of tumor sections 15-days post-treatment (scale bar = 100 μm). k IHC analysis of BRD4 expression in the tumor tissues (scale bar = 100 μm). l Western blot assay of BRD4, CDK6, CDK4, p21, cleaved-caspase-3 expression of HN30 tumor tissues post tumor-bearing mice subjected to various treatments. All data are presented as mean ± SD.

