Fig. 1.
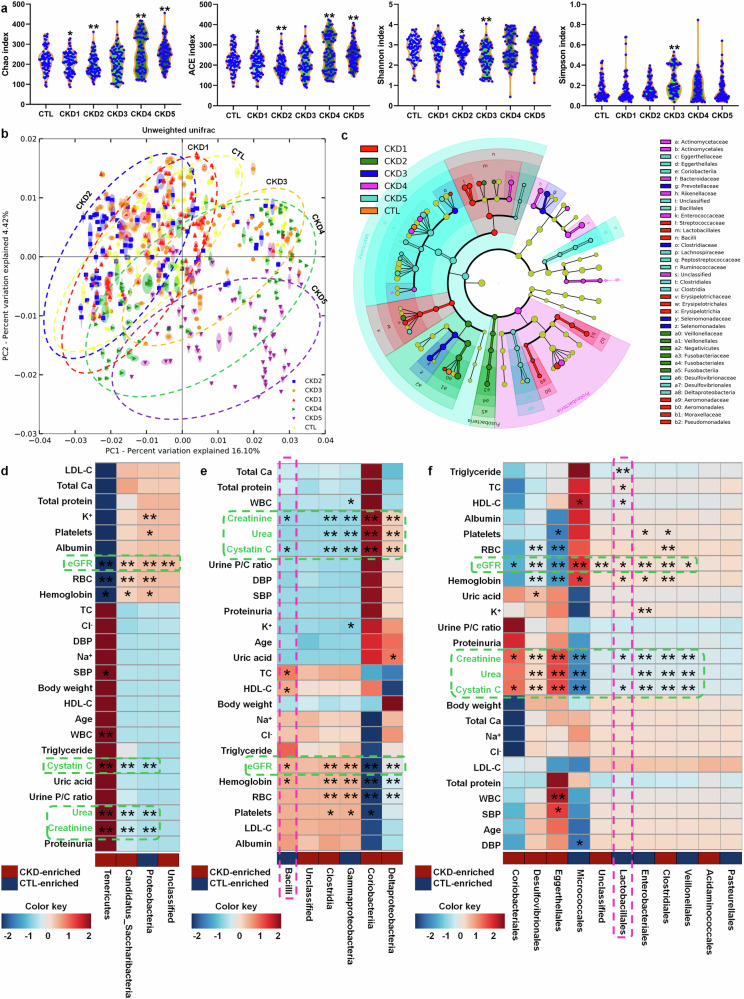
Microbial dysbiosis in patients with CKD progression. a α-diversity (Chao, ACE, Shannon and Simpson indexes) in controls and five stages of CKD patients (control, n = 80/group; CKD1, n = 81/group; CKD2, n = 80/group; CKD3, n = 79/group; CKD4, n = 79/group; CKD5, n = 81/group). *P < 0.05, **P < 0.01 compared with healthy controls. b PCoA based on unweighted UniFrac in controls and five stages of CKD patients. c Cladogram presented crucial bacteria with an evolutionary relationship associated with CKD based on linear discriminant analysis effect size. Each circle showed a classification level from phylum to species, from the inner to outer circles. The size of each circle is proportional to relative abundance. d Associations between 4 significantly changed bacteria at the phylum level and 25 physiological and biochemical indexes in patients with CKD. e Associations between 6 significantly changed bacteria at the class level and 25 physiological and biochemical indexes in patients with CKD. f Associations between 11 significantly changed bacteria at the order level and 25 physiological and biochemical indexes in patients with CKD. *P < 0.05, **P < 0.01

