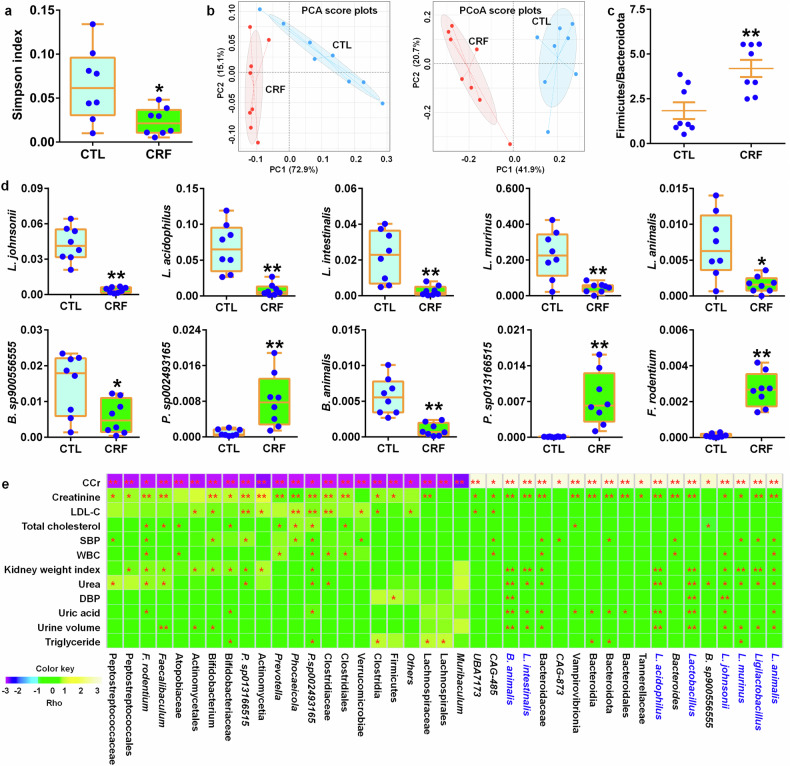
Fig. 3.
Reduced L. johnsonii abundance positively correlated with renal function decline in adenine-induced CRF rats. a Simpson index of control and CRF rats at the gene level. *P < 0.05, **P < 0.01 compared with control rats (n = 8/group). b PCA and PCoA of control and CRF rats at the gene level. c Firmicutes/Bacteroidota ratio of control and CRF rats. *P < 0.05, **P < 0.01 compared with control rats (n = 8/group). d The abundance of 10 significantly differential bacteria of control and CRF rats at the species level. *P < 0.05, **P < 0.01 compared with control rats (n = 8/group). e Heatmap of the Spearman’s rank correlation coefficient showing 41 bacteria at the different levels that correlate with physiological and biochemical indexes linked positively or negatively to CRF. Rho in the color key represents the Spearman rank correlation coefficient. *P < 0.05, **P < 0.01. Data are represented as mean ± SEM

