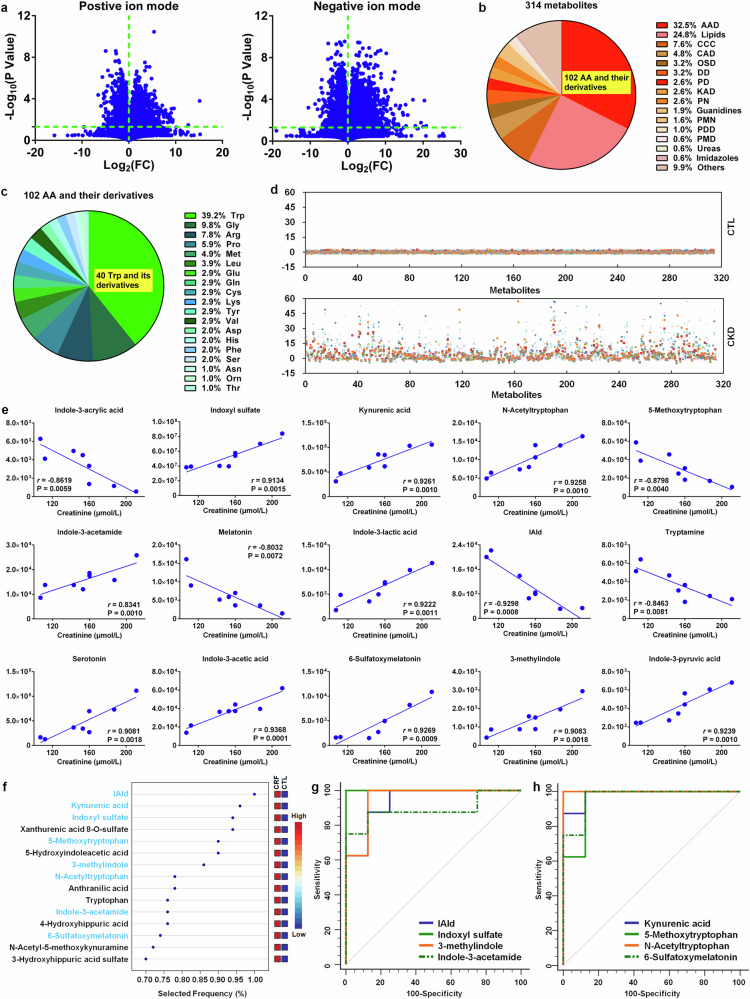
Fig. 5.
Significantly altered indole metabolites of tryptophan are correlated with renal function decline in the adenine-induced CRF rats. a The geometric mean ratio of each variable in CRF rats versus control rats was presented in positive and negative ion modes. b Pie chart based on 314 serum metabolites from control and CRF rats. c Pie chart based on 102 amino acid metabolites from control and CRF rats. d z-score plot of 314 metabolites in control and CRF rats. Each point represents an individual metabolite in one sample. Z-score plots for the data are normalized to the mean of control samples. e The associations between creatinine levels and intensities of tryptophan metabolites in CRF rats. Metabolites were selected based on r > 0.800. f Top metabolites presented by VIP scores based on classification method of linear support vector machines by feature ranking method of support vector machines built-in. Support vector machines models were constructed with tryptophan and its 39 metabolites from control and CRF rats. Red and blue indicate increased and decreased levels, respectively. g Analysis of PLS-DA based ROC curves of 4 tryptophan metabolites by gut microbiota in control and CRF rats. h Analysis of PLS-DA based ROC curves of 4 tryptophan metabolites by host in control and CRF rats

