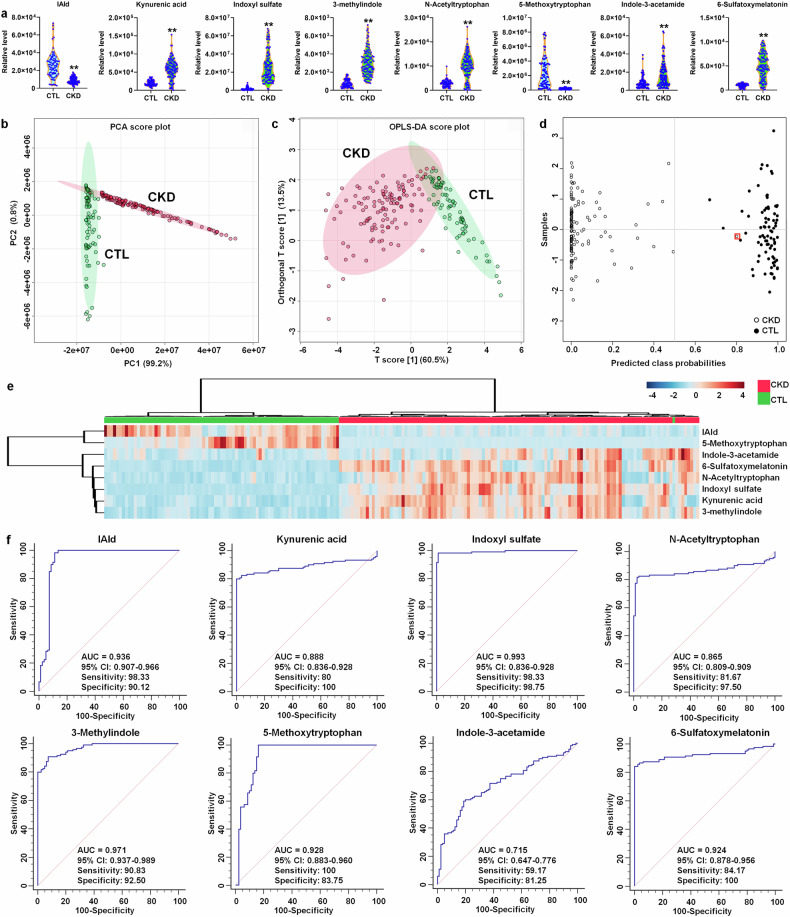
Fig. 6.
Aberrant microbial-derived indole derivatives from tryptophan metabolism were associated with CKD patients. a Violin plot showing the relative levels of eight tryptophan metabolites in controls and CKD patients. In the plot, the median, 75th percentile and 25th percentile are represented by the center line, upper dashed line and lower dashed line, respectively. *P < 0.05, **P < 0.01 compared with controls (controls, n = 80/group; CKD, n = 120/group). b PCA score plots of eight tryptophan metabolites from 80 controls and 120 CKD patients. c OPLS-DA score plots of eight tryptophan metabolites from 80 control and 120 CKD patients. d Diagnostic performances of eight tryptophan metabolites based on the support vector machines method. The black circles with red squares are for the incorrectly predicted samples in control group. e Heatmap of eight tryptophan metabolites between controls and CKD patients. f Analysis of PLS-DA based ROC curves of eight tryptophan metabolites in controls and CKD patients

