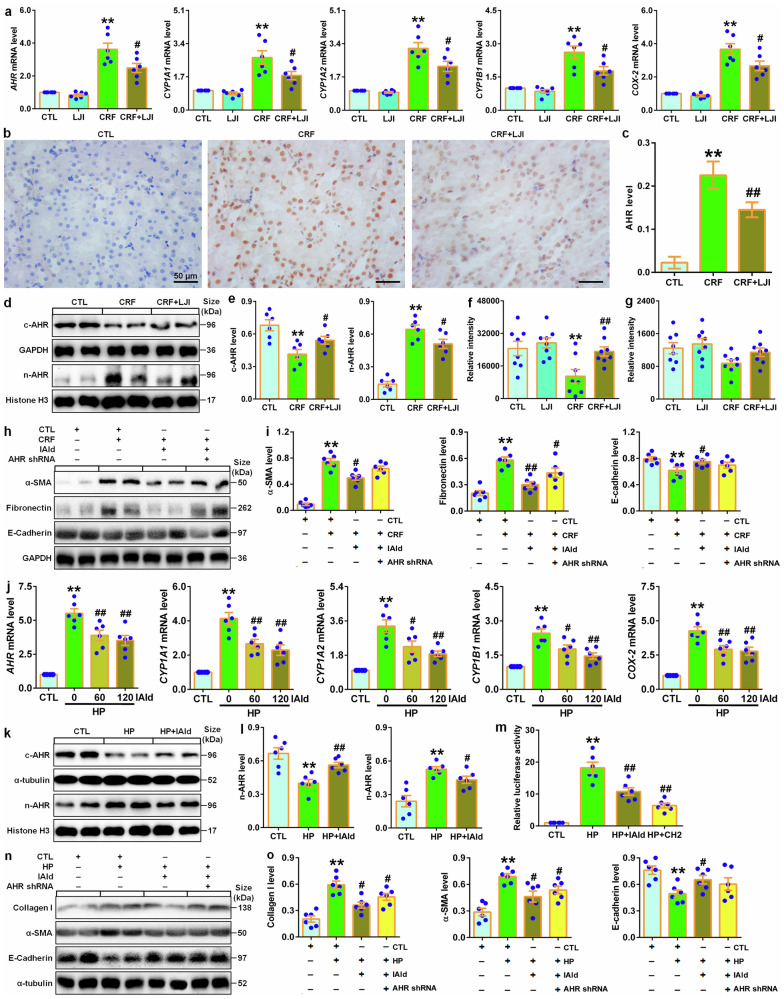
Fig. 9.
IAld protected against renal fibrosis through inhibiting AHR signaling pathway. a Intrarenal mRNA levels of AHR and its target genes including CYP1A1, CYP1A2, CYP1B1 and COX-2 in the control, LJI, CRF and LJI-treated CRF rats. b Immunohistochemical analysis with anti-AHR of kidney tissues in the control, CRF and LJI-treated CRF rats. Scale bar, 50 μm. c Quantitative analysis of immunohistochemistry with anti-AHR of kidney tissues in the control, CRF and LJI-treated CRF rats. d Protein expression of AHR in cytoplasm and nuclei of kidney tissues in the control, CRF and LJI-treated CRF rats. e Quantitative analysis of AHR expression in cytoplasm and nuclei of kidney tissues in the control, CRF and LJI-treated CRF rats. f Serum IAld relative intensity in the control, LJI, CRF and LJI-treated CRF rats. g Fecal IAld relative intensity in the control, LJI, CRF and LJI-treated CRF rats. h Protein expression of α-SMA, fibronectin and E-cadherin of kidney tissues in indicated groups. i Quantitative analyses of α-SMA, fibronectin and E-cadherin of kidney tissues in indicated groups. j The mRNA expression levels of AHR and its target genes including CYP1A1, CYP1A2, CYP1B1 and COX-2 in indicated groups. k Protein levels of AHR in cytoplasm and nuclei of HK-2 cells in indicated groups. l Quantitative analysis of AHR expression in in cytoplasm and nuclei of HK-2 cells in indicated groups. m Luciferase assays of AHR of HK-2 cells in indicated groups. n Protein levels of α-SMA, fibronectin and E-cadherin of HK-2 cells in indicated groups. o Quantitative analyses of α-SMA, fibronectin and E-cadherin of HK-2 cells in indicated groups. Dot presents the single data results in bar graph. *P < 0.05; **P < 0.01 compared with control rats or cells (n = 6/group). #P < 0.05; ##P < 0.01 compared with adenine-induced CRF rats or HP-induced HK-2 cells (n = 6/group). Data are represented as mean ± SEM

