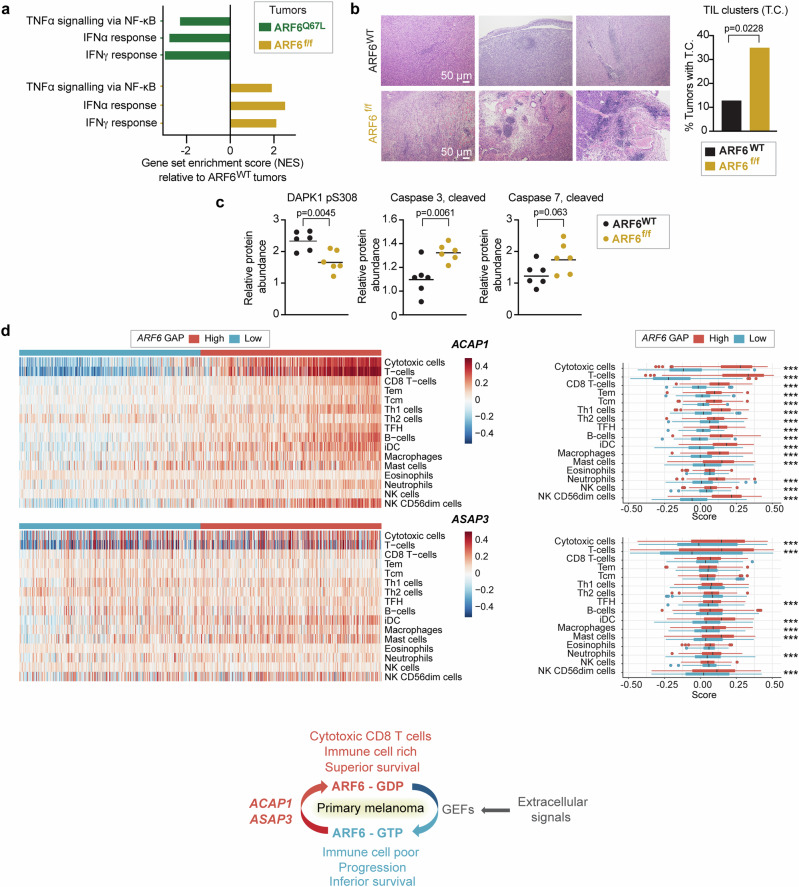
Fig. 2. ARF6-dependent tumour inflammation and apoptosis.
a Shared significantly enriched gene sets (MSigDB Hallmark), but in opposite directions, between ARF6f/f and ARF6Q67L tumours from bulk tumour transcriptomes (n = 6 ARF6f/f vs. n = 6 ARF6WT tumours, n = 6 ARF6Q67L vs. n = 4 ARF6WT tumours). See also Supplementary Fig. 1e, f. b Representative images of H&E staining showing clusters of small round blue cells, i.e., tumour-infiltrating lymphocytes (TIL) clusters, scale bars = 50 μm, and fractions of tumours with TIL clusters (n = 46 ARF6WT controls, n = 40 ARF6f/f tumours), Fisher’s exact test, two-sided. c Apoptotic protein profile of tumours (n = 6 mice each) detected by Reverse Phase Protein Array, two-tailed t-test. Solid line within data points = geometric mean. d Immune cell gene set enrichment in primary human melanoma (Leeds melanoma, n = 350), supervised clustering with ARF6 GAP expression (related to Fig. 1b). The box corresponds second and third quartiles. The middle horizontal line = median. Dots are outlier further than 1.5 * IQR (inter-quartile range). ***p < 0.001. ACAP1 cytotoxic T cells p = 9.924 × 10−124, T cells p = 2.636 × 10−141. ASAP3 cytotoxic T cells p = 2.7081 × 10⁻⁸, T cells p = 1.2997 × 10⁻⁸. two-tailed t-test. Schematic = ARF6 activation cycle related to ARF6 GAP expression detected in primary tumours, and associated immune cell signatures and survival outcome. See also Supplementary Fig. 1c, d. Source data are provided as a Source Data file.

