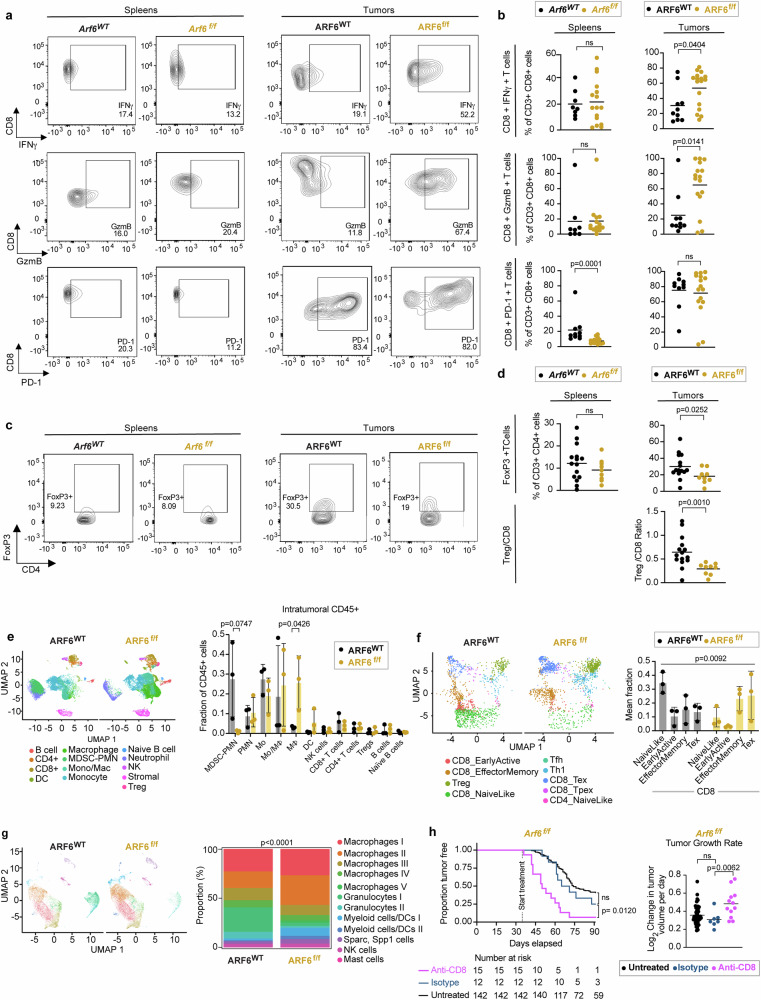
Fig. 3. Heightened anti-tumour immunity in ARF6f/f tumours.
a Flow cytometry charts and (b) quantification of IFNγ (spleens: Arf6WT n = 8, Arf6f/f n = 16; tumours: ARF6WT n = 10, ARF6f/f n = 17), granzyme B (GmzB) (spleens: Arf6WT n = 8, Arf6f/f n = 15; tumours: ARF6WT n = 10, ARF6f/f n = 16) and PD-1(spleens: Arf6WT n = 10, Arf6f/f n = 15; tumours: ARF6WT n = 10, ARF6f/f n = 16 in CD8+ T cells from spleens and tumours of mice bearing ARF6WT or ARF6f/f tumours upon T cell reactivation), two-tailed Mann Whitney test. c Flow charts and (d) quantification of the CD4+ FoxP3+ regulatory T cell fraction from spleens and tumours (spleens: Arf6WT n = 15, Arf6f/f n = 9; tumours: ARF6WT n = 15, ARF6f/f n = 19) of mice bearing ARF6WT or ARF6f/f tumours and Treg/CD8 ratio (tumours: ARF6WT n = 15, ARF6f/f n = 19), two-tailed Mann Whitney test. e Uniform manifold approximation and projection (UMAP) (scRNA-seq) showing intratumoural CD45+ cells (n = 19,367 cells from ARF6WT, n = 28,003 cells from ARF6f/f tumours, n = 3 tumours of each genotype) and histogram showing mean % of immune cell types among total CD45+ cells. Unpaired t-tests Two-stage step-up (Benjamini, Krieger, and Yekutieli). f UMAP showing projection of T cell clusters onto ProjecTILs reference and histogram showing mean % of CD8 T cell subtypes among total CD8+T cells. (n = 1402 cells from ARF6WT, n = 1661 cells from ARF6f/f, n = 3 tumours of each genotype) Likelihood ratio test, mixed effects model with fixed group effect and random effect for samples within groups. Two-way ANOVA with Sidak’s multiple comparisons tests (g) UMAP showing tumour infiltrating myeloid cells and stacked histogram showing proportion of each cell type (%) (n = 12,295 cells from ARF6WT, n = 13,807 cells from ARF6f/f tumours, n = 3 tumours of each genotype). Two-sided chi-square test of homogeneity. h Tumour-free survival (Two-sided Kaplan–Meier log-rank test) and rate of tumour growth (untreated n = 50, isotype n = 7, anti-CD8 n = 12), Two-tailed Welch’s t-test, Arf6f/f mice with or without CD8 T cell depletion. Antibody treatments were initiated when mice were 5 weeks old and continued for 8 weeks. See also Supplementary Figs. 2 and 3. b, d, h Solid line within data points = mean. e–f Solid line within data points = mean. Error bars = SD. Source data are provided as a Source Data file.

