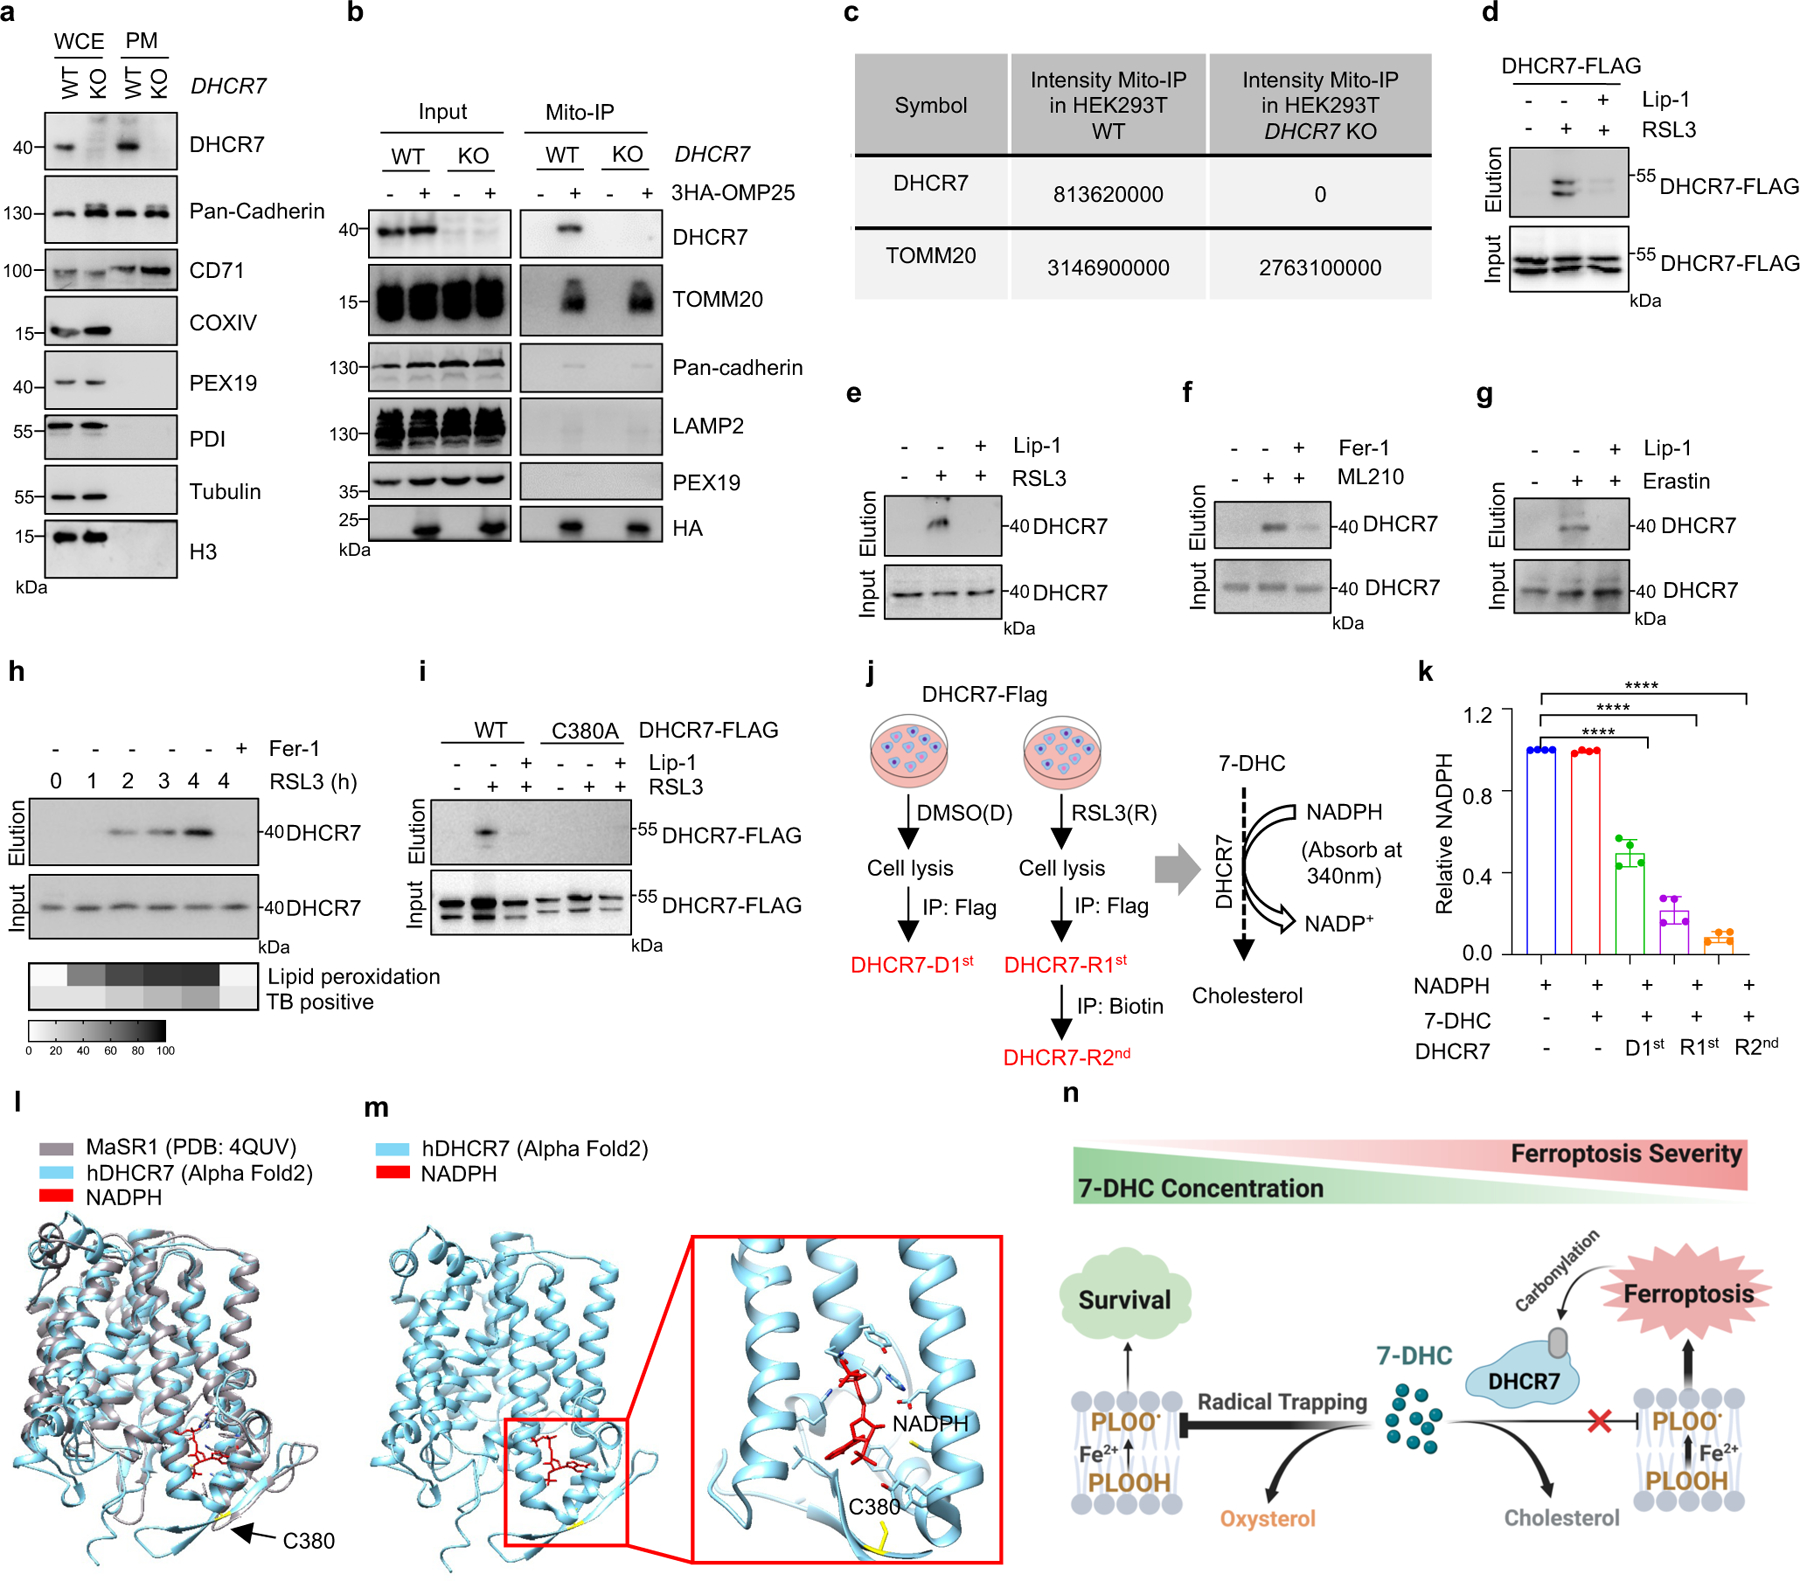
Extended Data Fig. 7|. Regulation of 7-DHC level during ferroptosis.

a, DHCR7 location in cell plasma membrane (PM) was detected by immunoblotting. b, Cells expressing vector or 3HA-OMP25 were performed mitochondria immunoprecipitation, DHCR7 was detected in mitochondria by immunoblotting. c, The captured mitochondria were used for LC/MS detection. Proteins identified by the mass spectrometry. d, Detection of DHCR7 carbonylation in HEK293T cells expressed DHCR7-FLAG after induced with RSL3 (6 μM) following treatment of Lip-1 (10 μM). e-g, m-APA labeled carbonylation of DHCR7 in HEK293T cells treated with RSL3 (6 μM) (e), ML210 (10 μM) (f) and in RCC4 treated with Erastin (10 μM) (g) following treatment of Lip-1 (10 μM) or Fer-1 (1 μM). h, m-APA labeled carbonylation of DHCR7 in HEK293T cells treated with RSL3 (5 μM) for indicated time. Level of lipid peroxidation and cell death (TB positive, TB: Trypan Blue) from indicated time points are depicted below in grey scale. i, m-APA selectively labeled carbonylation on C380 of HEK293T cells treated with RSL3 (4 μM). j, Schema of DHCR7 and carbonylated DHCR7 enrichment and the enzyme activity detection by NADPH-dependent reduction. DHCR7 from DMSO (DHCR7-D1st) or RSL3 (DHCR7-R1st) treatment group were enriched by Flag IP. Carbonylated DHCR7 (DHCR7-R2nd) were enriched from DHCR7-R1st by biotin IP. k, Relative DHCR7 enzyme activity detected by the reduction of NADPH. l, m, A structural comparison between the crystal structure of the delta-14 sterol reductase from M. alcaliphilum (grey) and the human DHCR7 structure predicted by AlphaFold2 (cyan), the same residues are found at the NAPDH-binding pocket (red). n, Proposed model of regulation of 7-DHC level during ferroptosis. Image created with BioRender. For a-i, data are representative of at least two independent experiments. For k, data are mean ± s.d. of n=4 biological replicates from two independent experiments. Statistical analysis was performed using one-way ANOVA (k), ***P < 0.001.
