
Fig. 4.
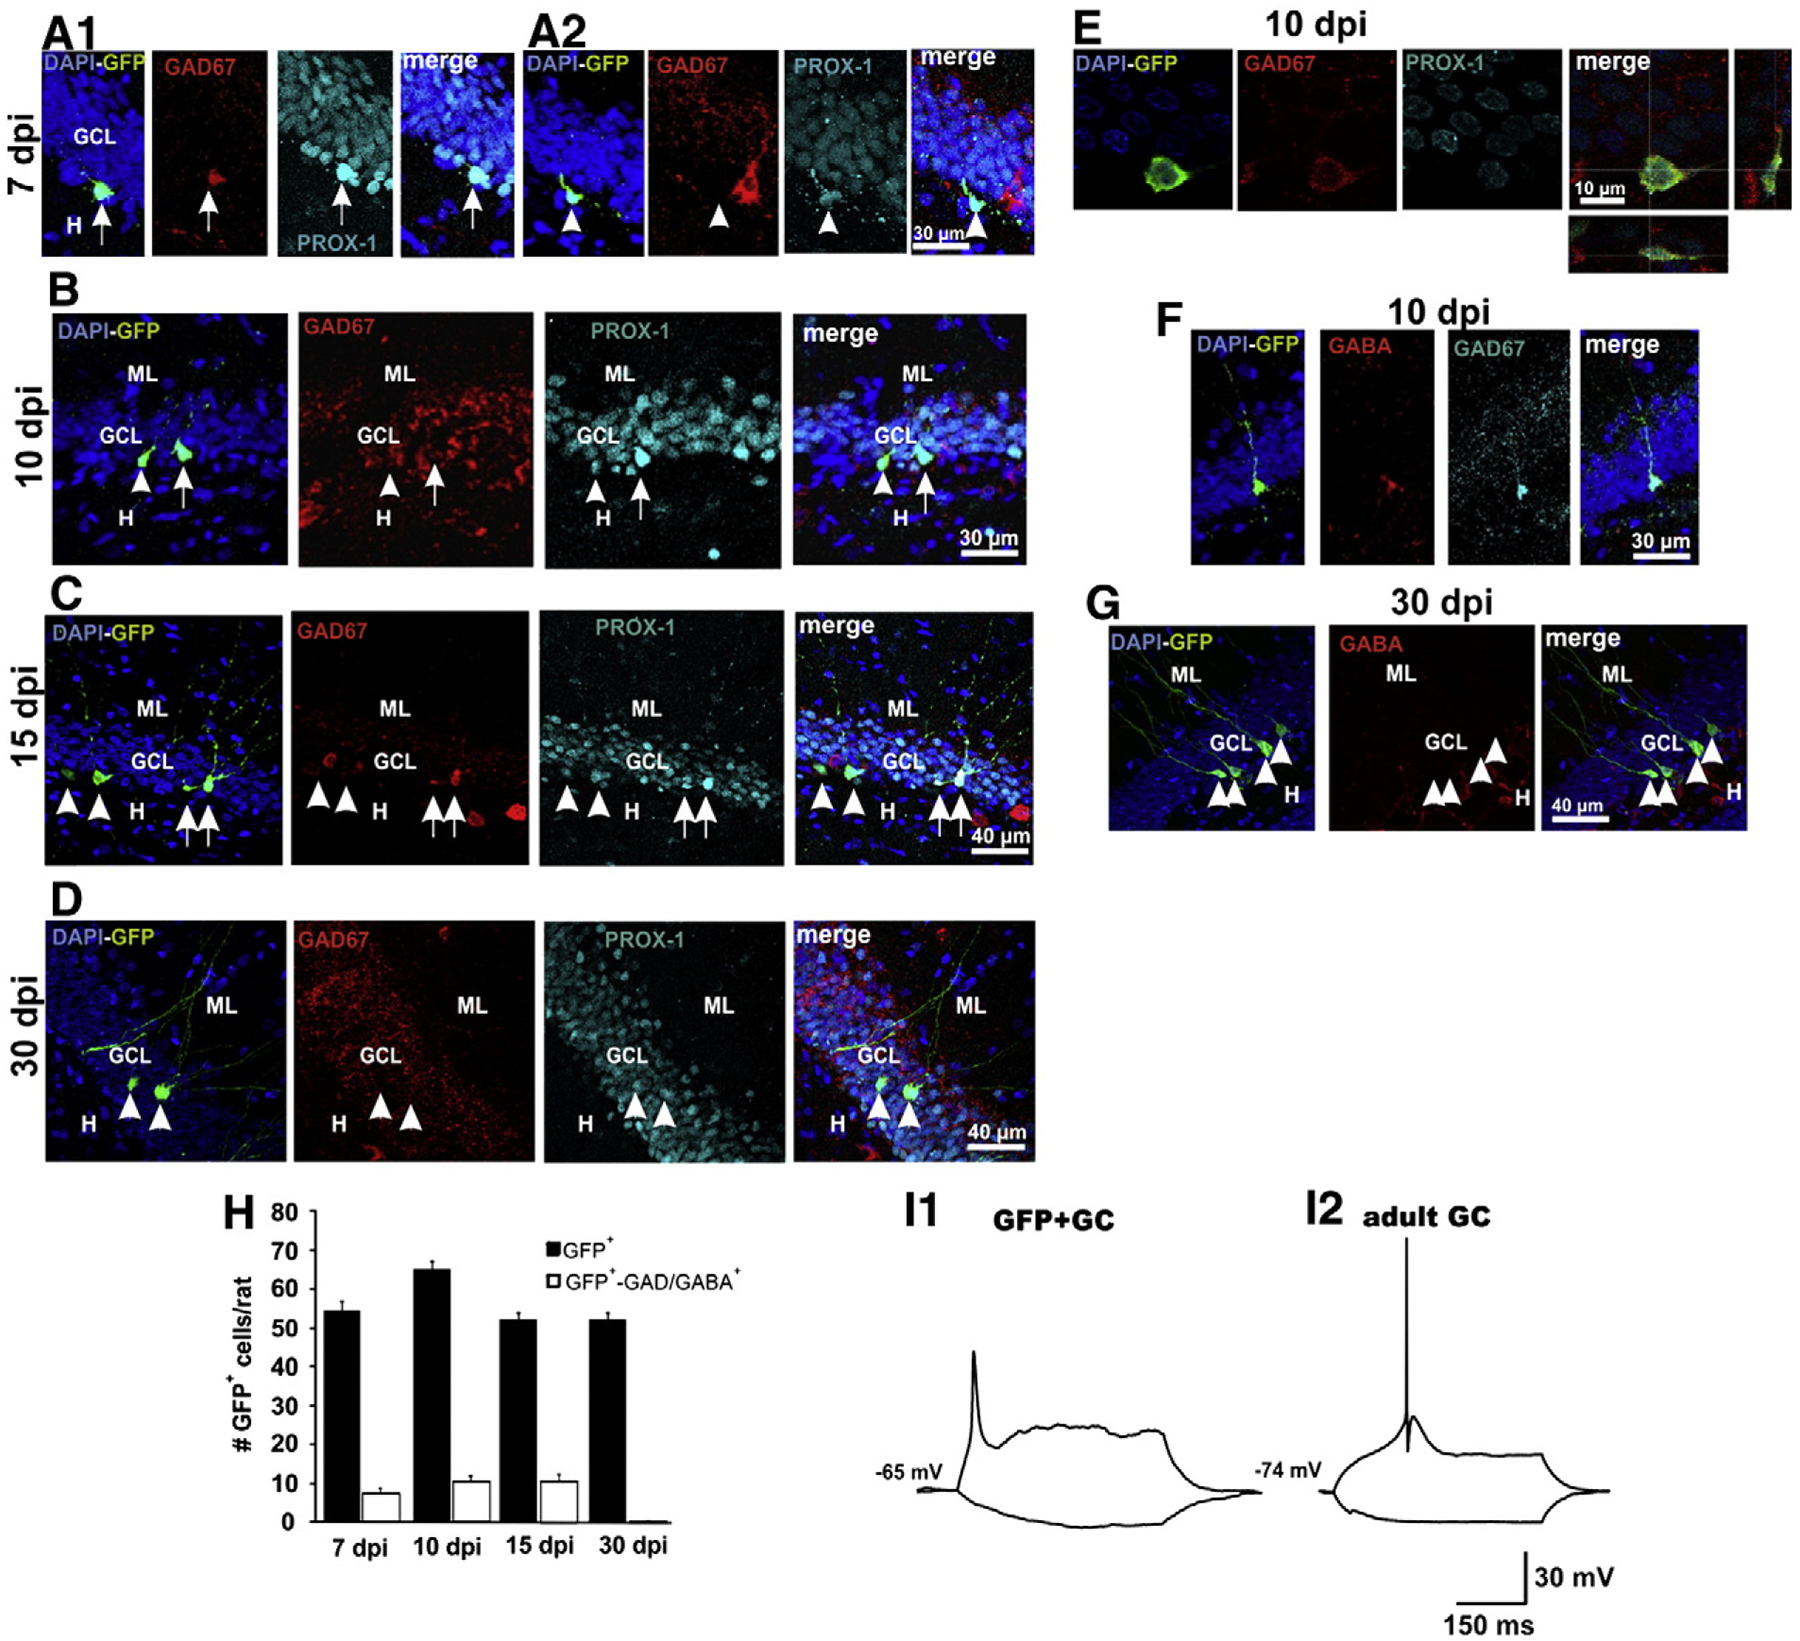
Expression of GABAergic markers in GCs born in the adult rat. A1) Confocal images at 7 dpi showing a GFP+ granule cell expressing GAD67 (arrow) and A2) a granule cell that does not express GAD67 (arrowhead). A interneuron can be observed beside the GFP+ granule cell. B and C) Images depicting newborn GCs at 10 and 15 dpi, respectively, which express (arrows) and do not express (arrowheads). D) At 30 dpi, no GFP+ granule cell expressed . E) Three-dimensional reconstructions through the Z-axis of GFP+ cells (fifty optical slices at 0.5 μm intervals) were used to verify the co-localization of GFP, GAD67 and Prox1. DAPI, blue; GAD67 Red; Overlay with Prox1, in light blue, and orthogonal projections are shown on the right panel. F) Confocal images depicting the coexistence of GAD67 and GABA in a GFP+ granule cell at 10 dpi. G) At 30 dpi, no GFP+ granule cell expressed GABA. Calibrations in the rightmost panels apply for all panels in the corresponding row. ML, molecular layer; GCL, granule cell layer; H, hilus. H) Mean number of GFP+ GCs per rat (black bars) and number of GFP+ GCs expressing GAD67/GABA at the different postinjection times (n=5/bar). I) Electrophysiological recordings of a developing GFP+ granule cell at 14 dpi and of an adult granule cell.