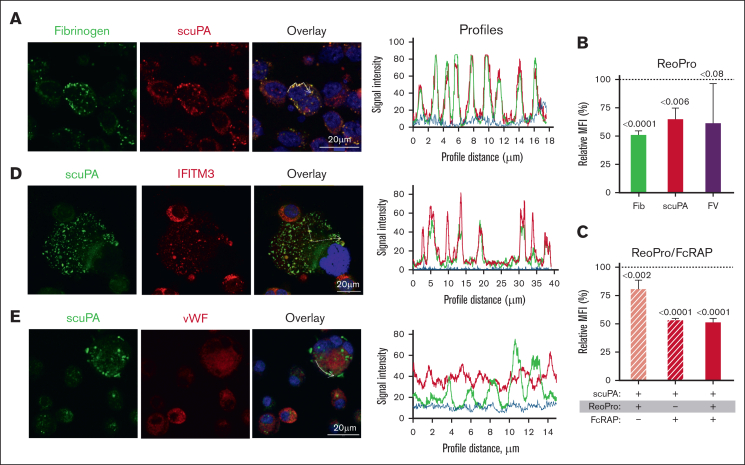
Figure 4.
αIIbβ3 mediates uptake of scuPA by CD34+ MKs. (A) Confocal images of day-11 CD34+ MKs loaded with Alexa-488 fibrinogen and Alexa-586 scuPA for 24 hours. Colocalization of scuPA and fibrinogen is depicted in yellow in the overlay panel (right). DAPI (blue) depicts the nuclei. Scale bar is shown. For quantitation of colocalization, see also Table 1. Profile measurements are as in Figure 2A. (B) Inhibition of scuPA, fibrinogen, and FV (200 nM each) uptake by ReoPro monoclonal antibody (200 μg/mL). (C) A similar study as in panel B but for scuPA alone and inhibition was by ReoPro (200 μg/mL) and/or FcRAP (200 μg/mL). In both, ordinate denotes percent of uptake inhibition by ReoPro and/or FcRAP. Data were analyzed using the 2-way ANOVA. Mean ± 1 SD is shown. n = 3 to 4 independent studies. Data were analyzed using a 2-way Student t test. (D-E) Confocal studies of MKs loaded with scuPA (600 nM) and stained with Alexa-488 mouse anti-uPA monoclonal antibody, and (D) anti-IFITM3 rabbit polyclonal antibody, (E) anti-VWF antibody rabbit polyclonal antibody, followed by Alexa-555 or Alexa-647 goat anti-rabbit polyclonal antibody (red). Nuclei were stained blue by DAPI. For quantitation of overlap, see also Table 1. Profile measurements in panels D-E are as in Figure 2A.

