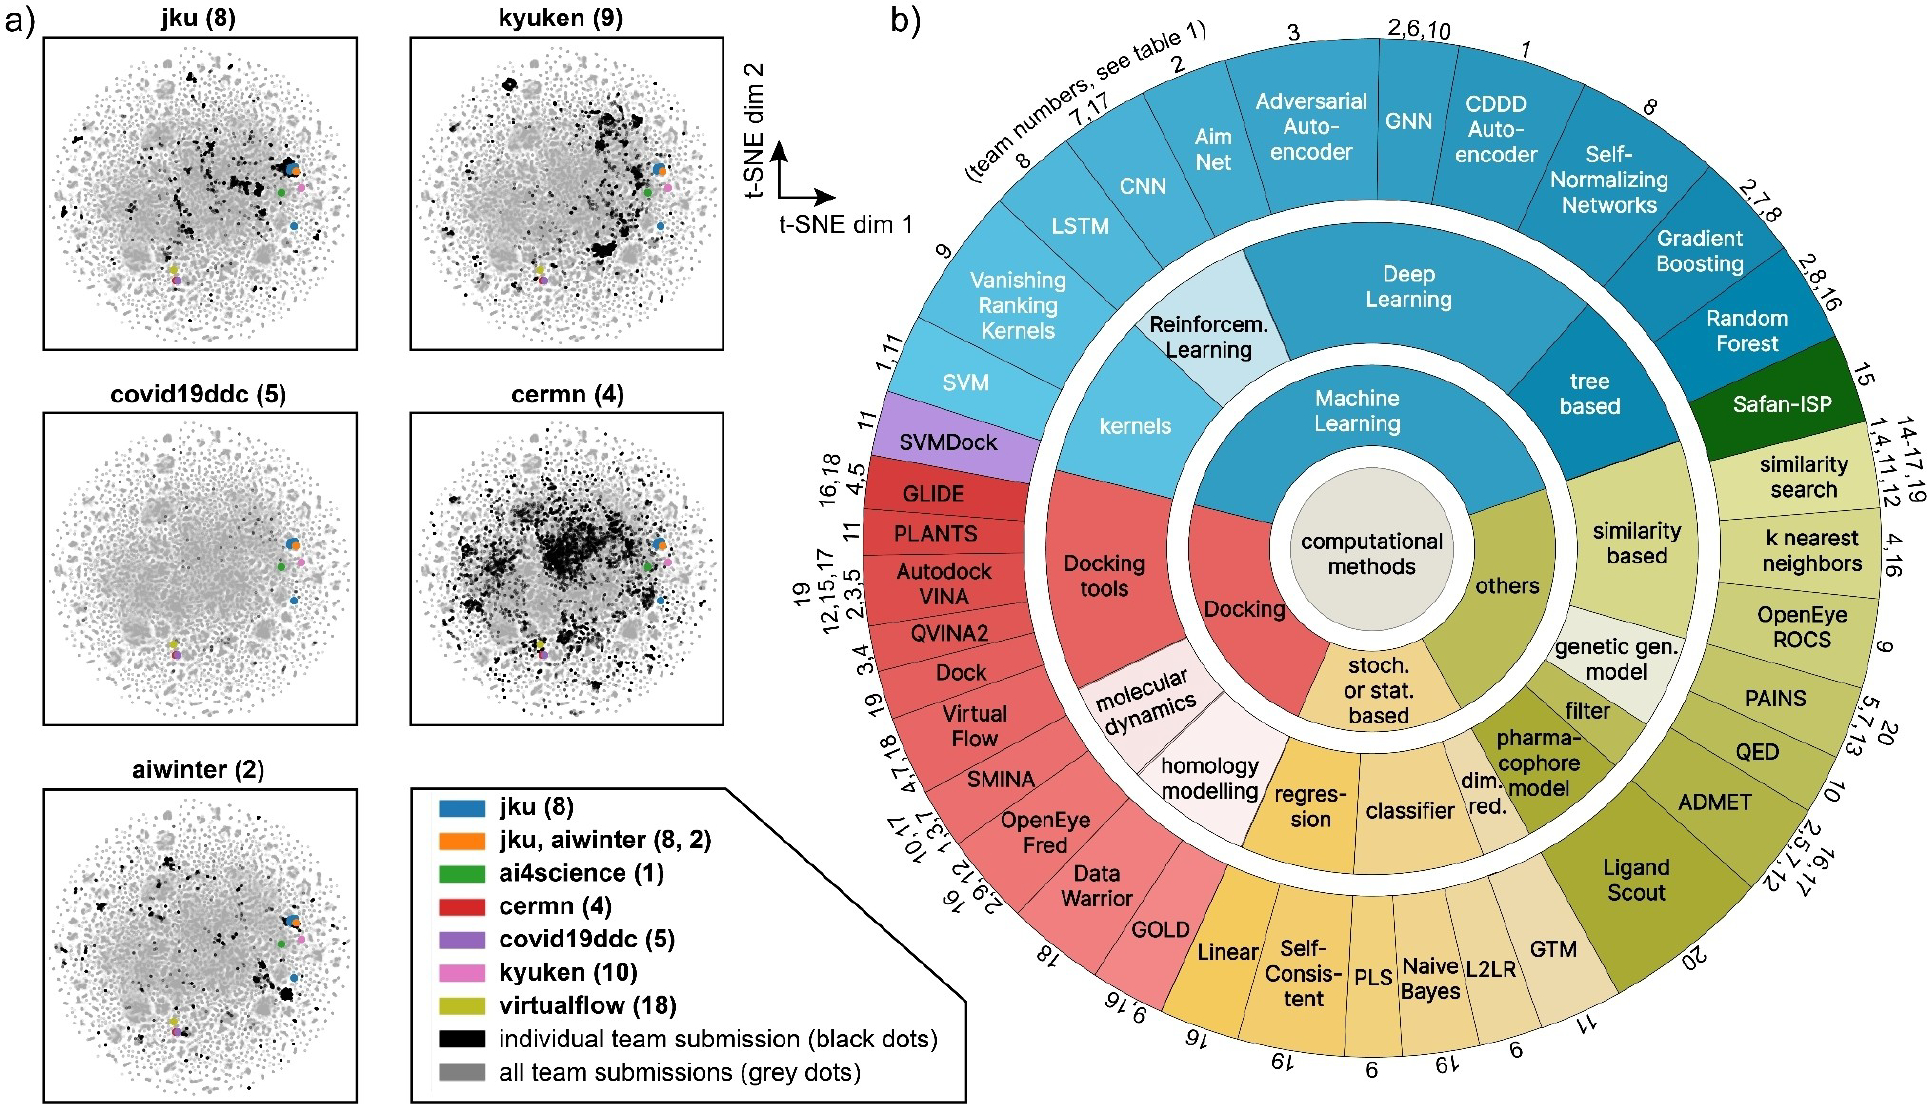
FIGURE 2.

a) Scatterplots in t-SNE coordinates which show the Nsp5 experimental hits (colored dots) and the submitted compounds by the teams (black dots for single team in each panel, gray dots for all submitted compounds by all teams). For t-SNE plots for each individual team see Figure S9a,b and Supporting Information Section 3. b) Overview of computational methods used by the different teams. Numbers correspond to participating teams (see Table 1).
