
FIGURE 4.
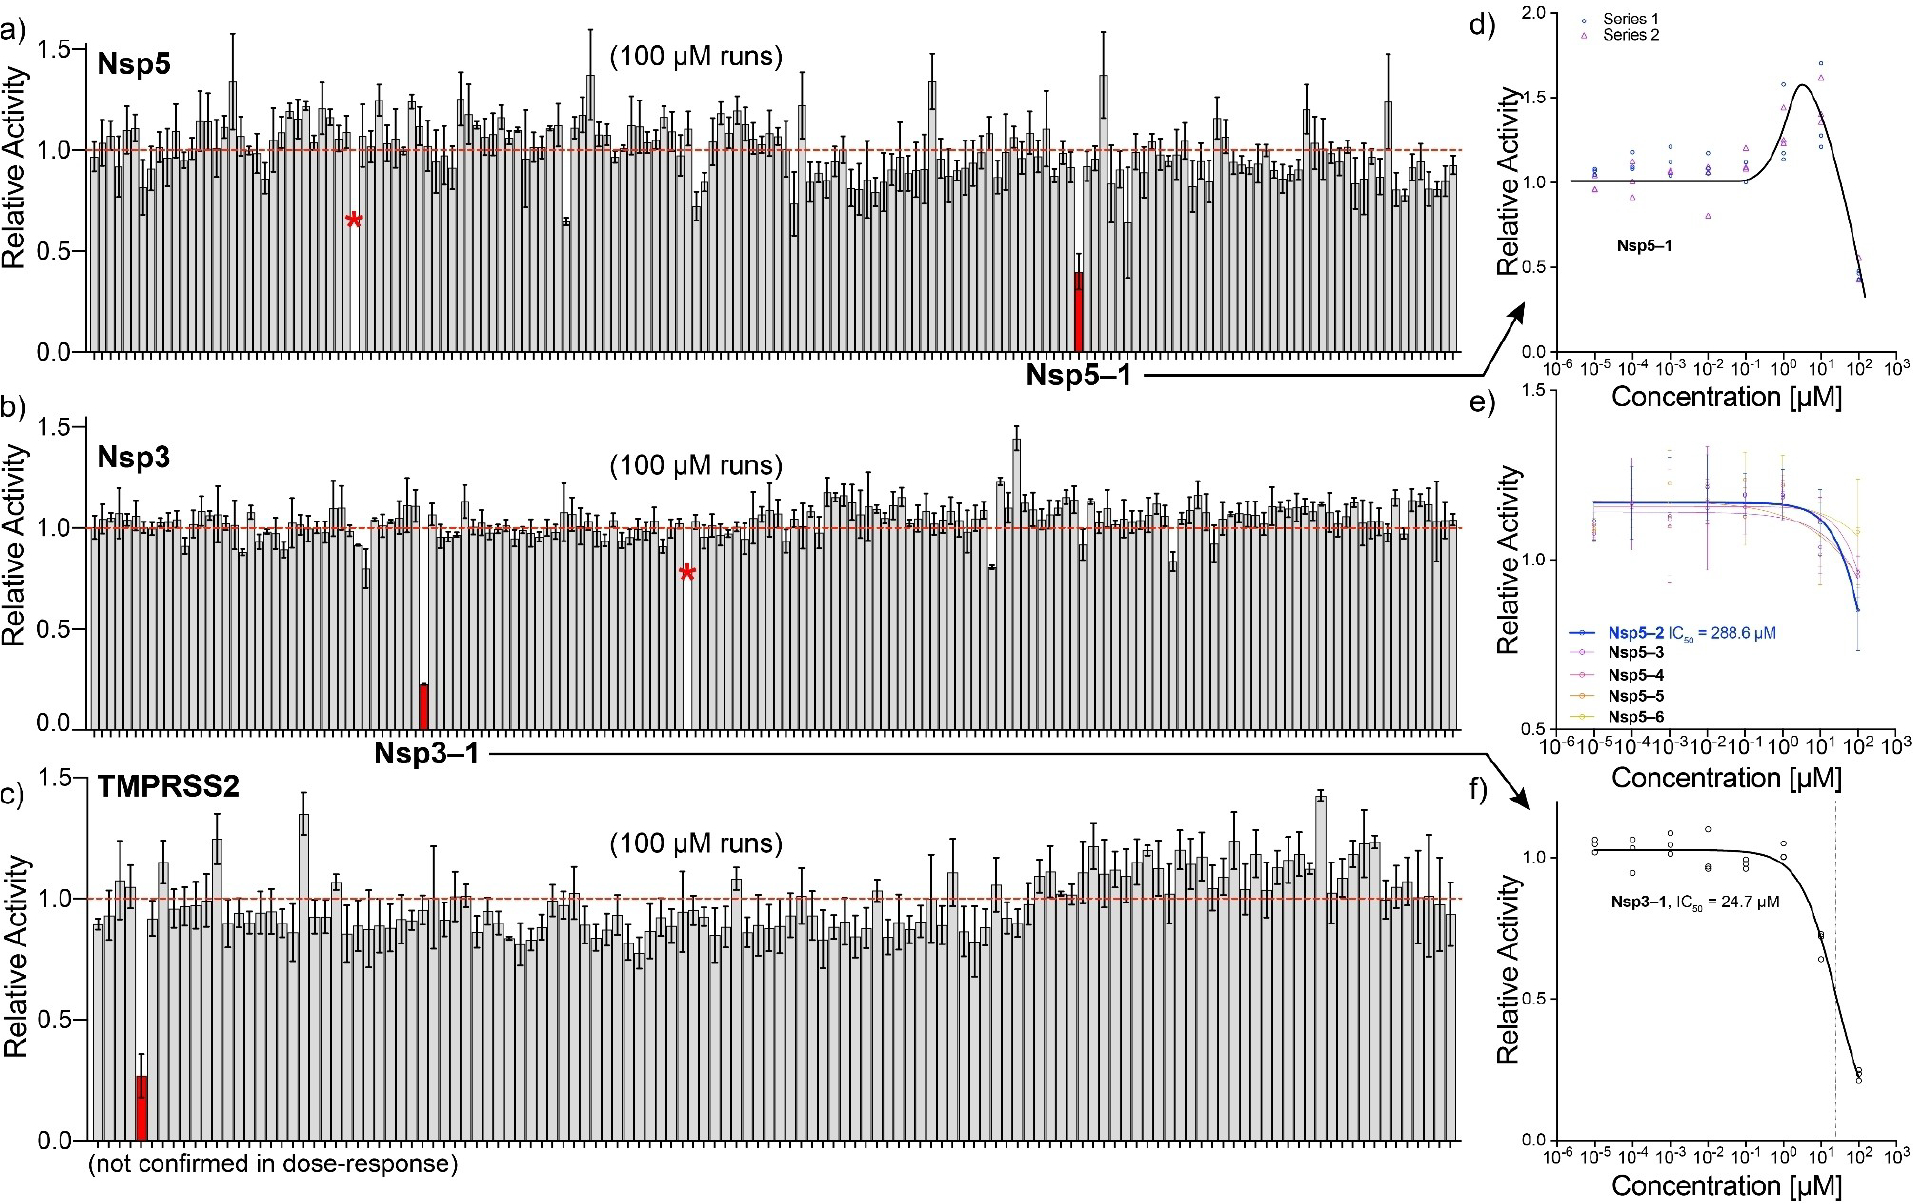
Overview of protease cleavage assays. a–c) relative activity over triplicate experiments at a fixed compound concentration of 100 μM for Nsp5, Nsp3 and TMPRSS2, respectively. Red bars show compounds that reduce cleavage (relative) activity by more than 50%. Asterisks show highly fluorescent compounds that could not be analyzed. Not all compound labels are listed for clarity. d–f) dose-response curves at different compound concentrations. Solid lines in panel e–f show fits, panel d to guide the eye.