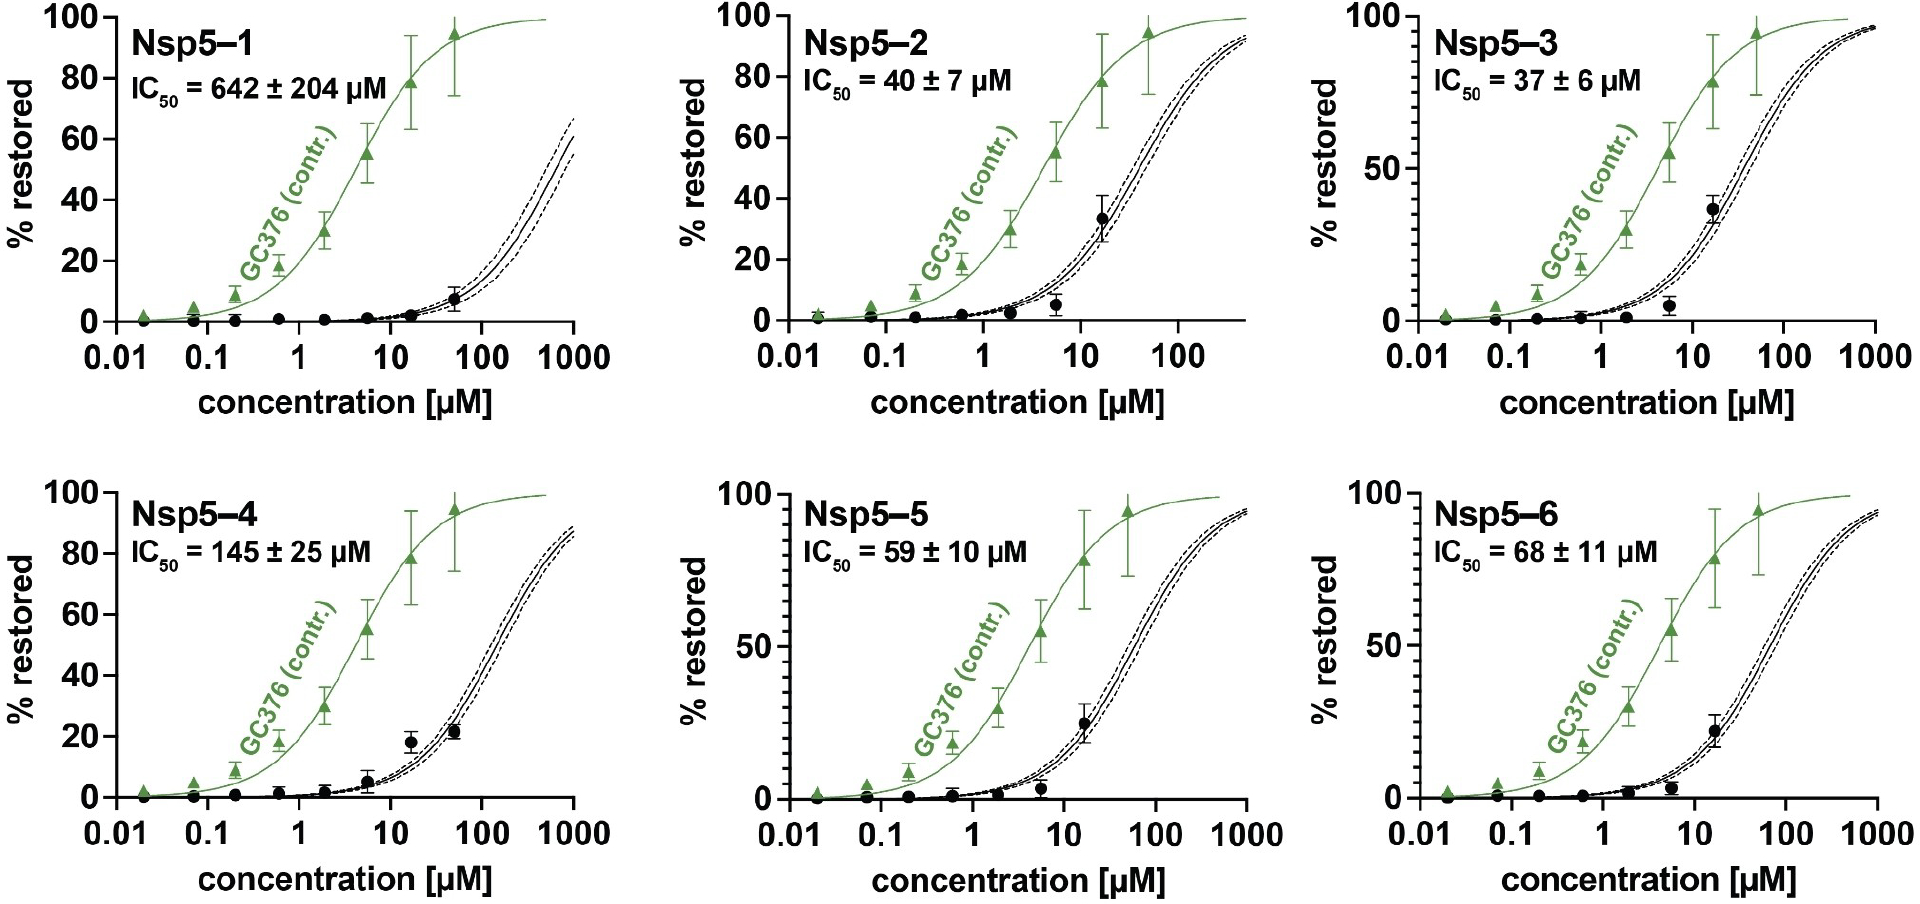
FIGURE 5.

Dose-response curves of compounds in cell-based Nsp5 protease assay. IC50 values are also in Table 3 below. Solid line: curve fit result. Dashed lines: 95% confidence interval. Data are expressed as the mean ± standard deviation of 3 independent experiments each performed in triplicate. Green triangles show positive controls for inhibitor GC376 (see Supporting Information section 4.3.2). Cytotoxicity was detected above 20 μM, so higher concentrations were excluded.
