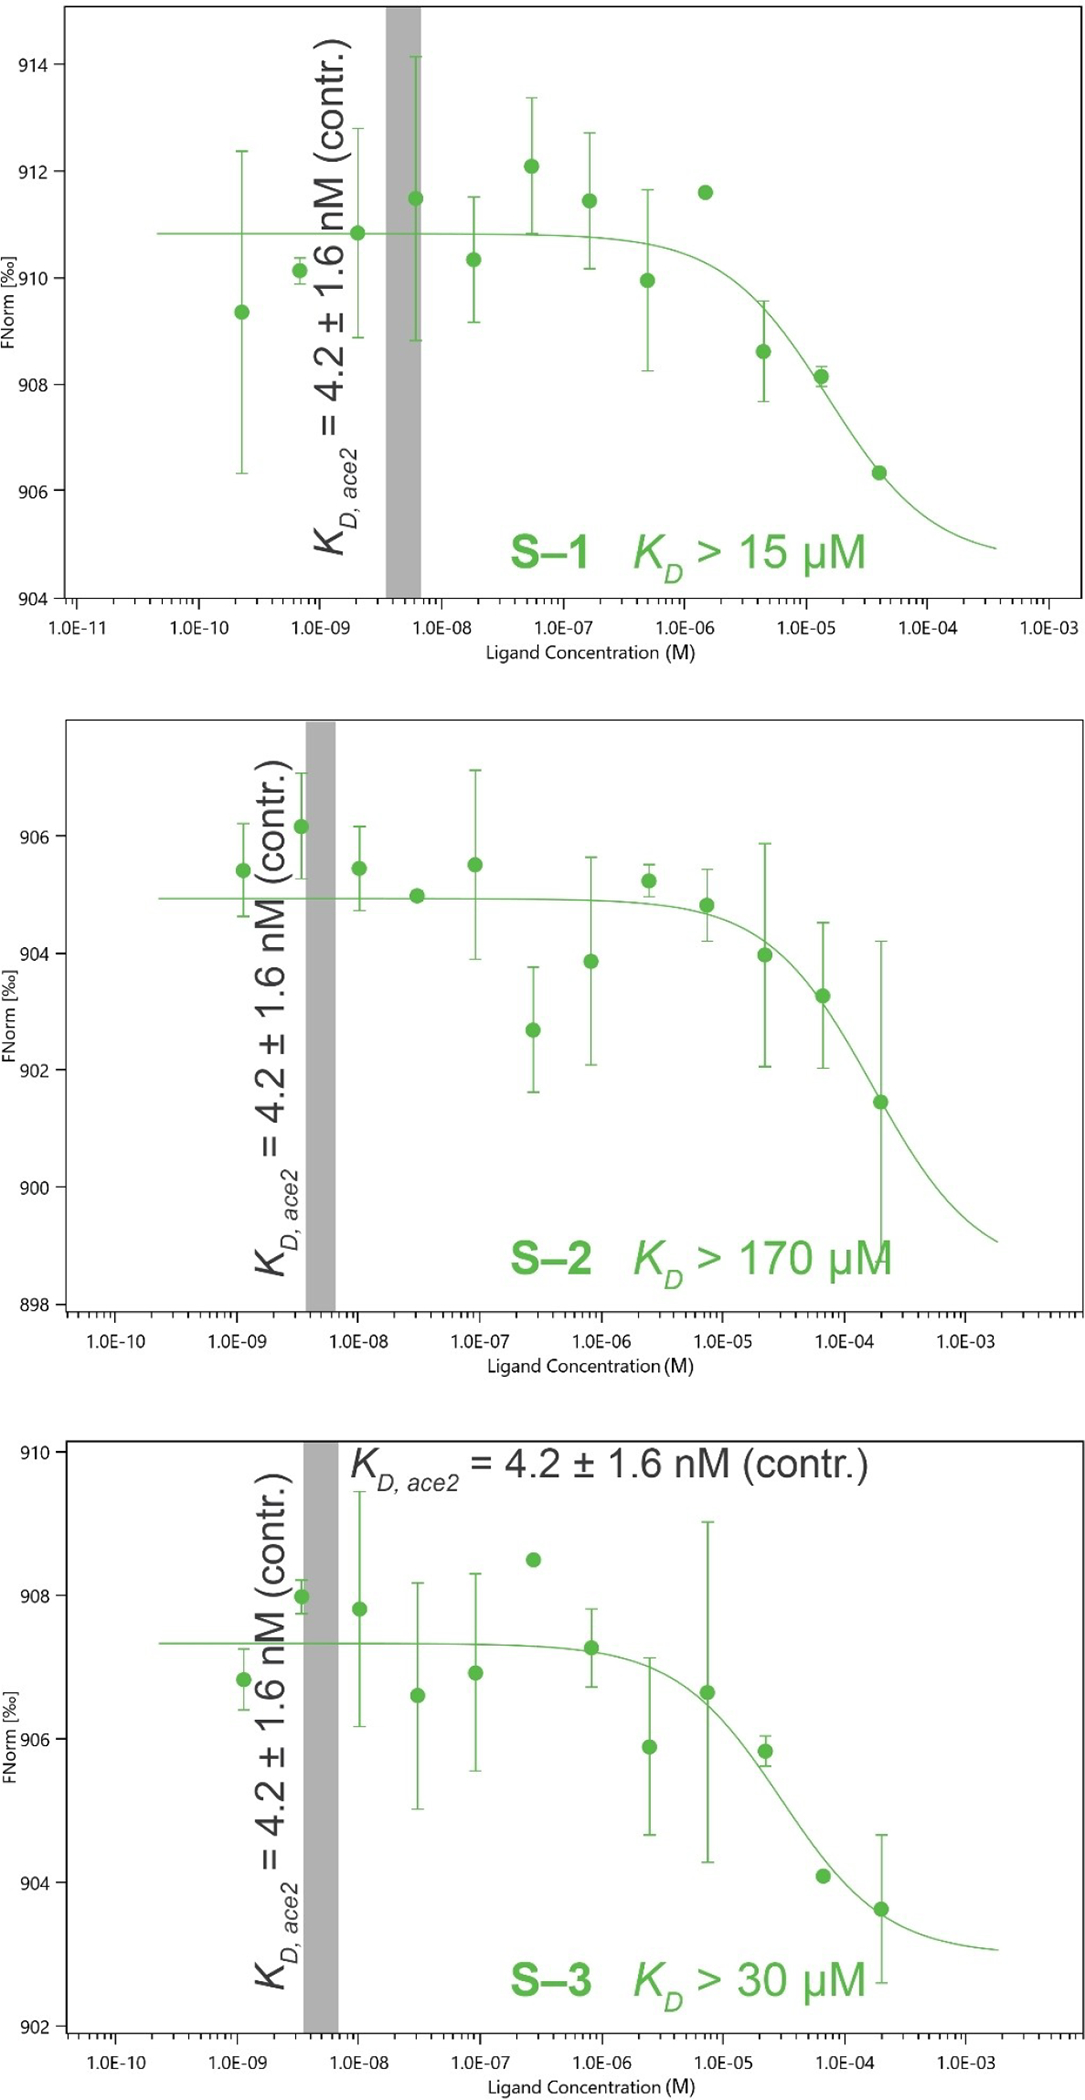
FIGURE 6.

Binding curves of S compounds using Microscale thermophoresis performed in triplicate. Error bars show standard deviations. The gray region shows the KD for positive control Ace2. See Supporting Information Section 4.2 for details on assay conditions.
