
Figure 2.
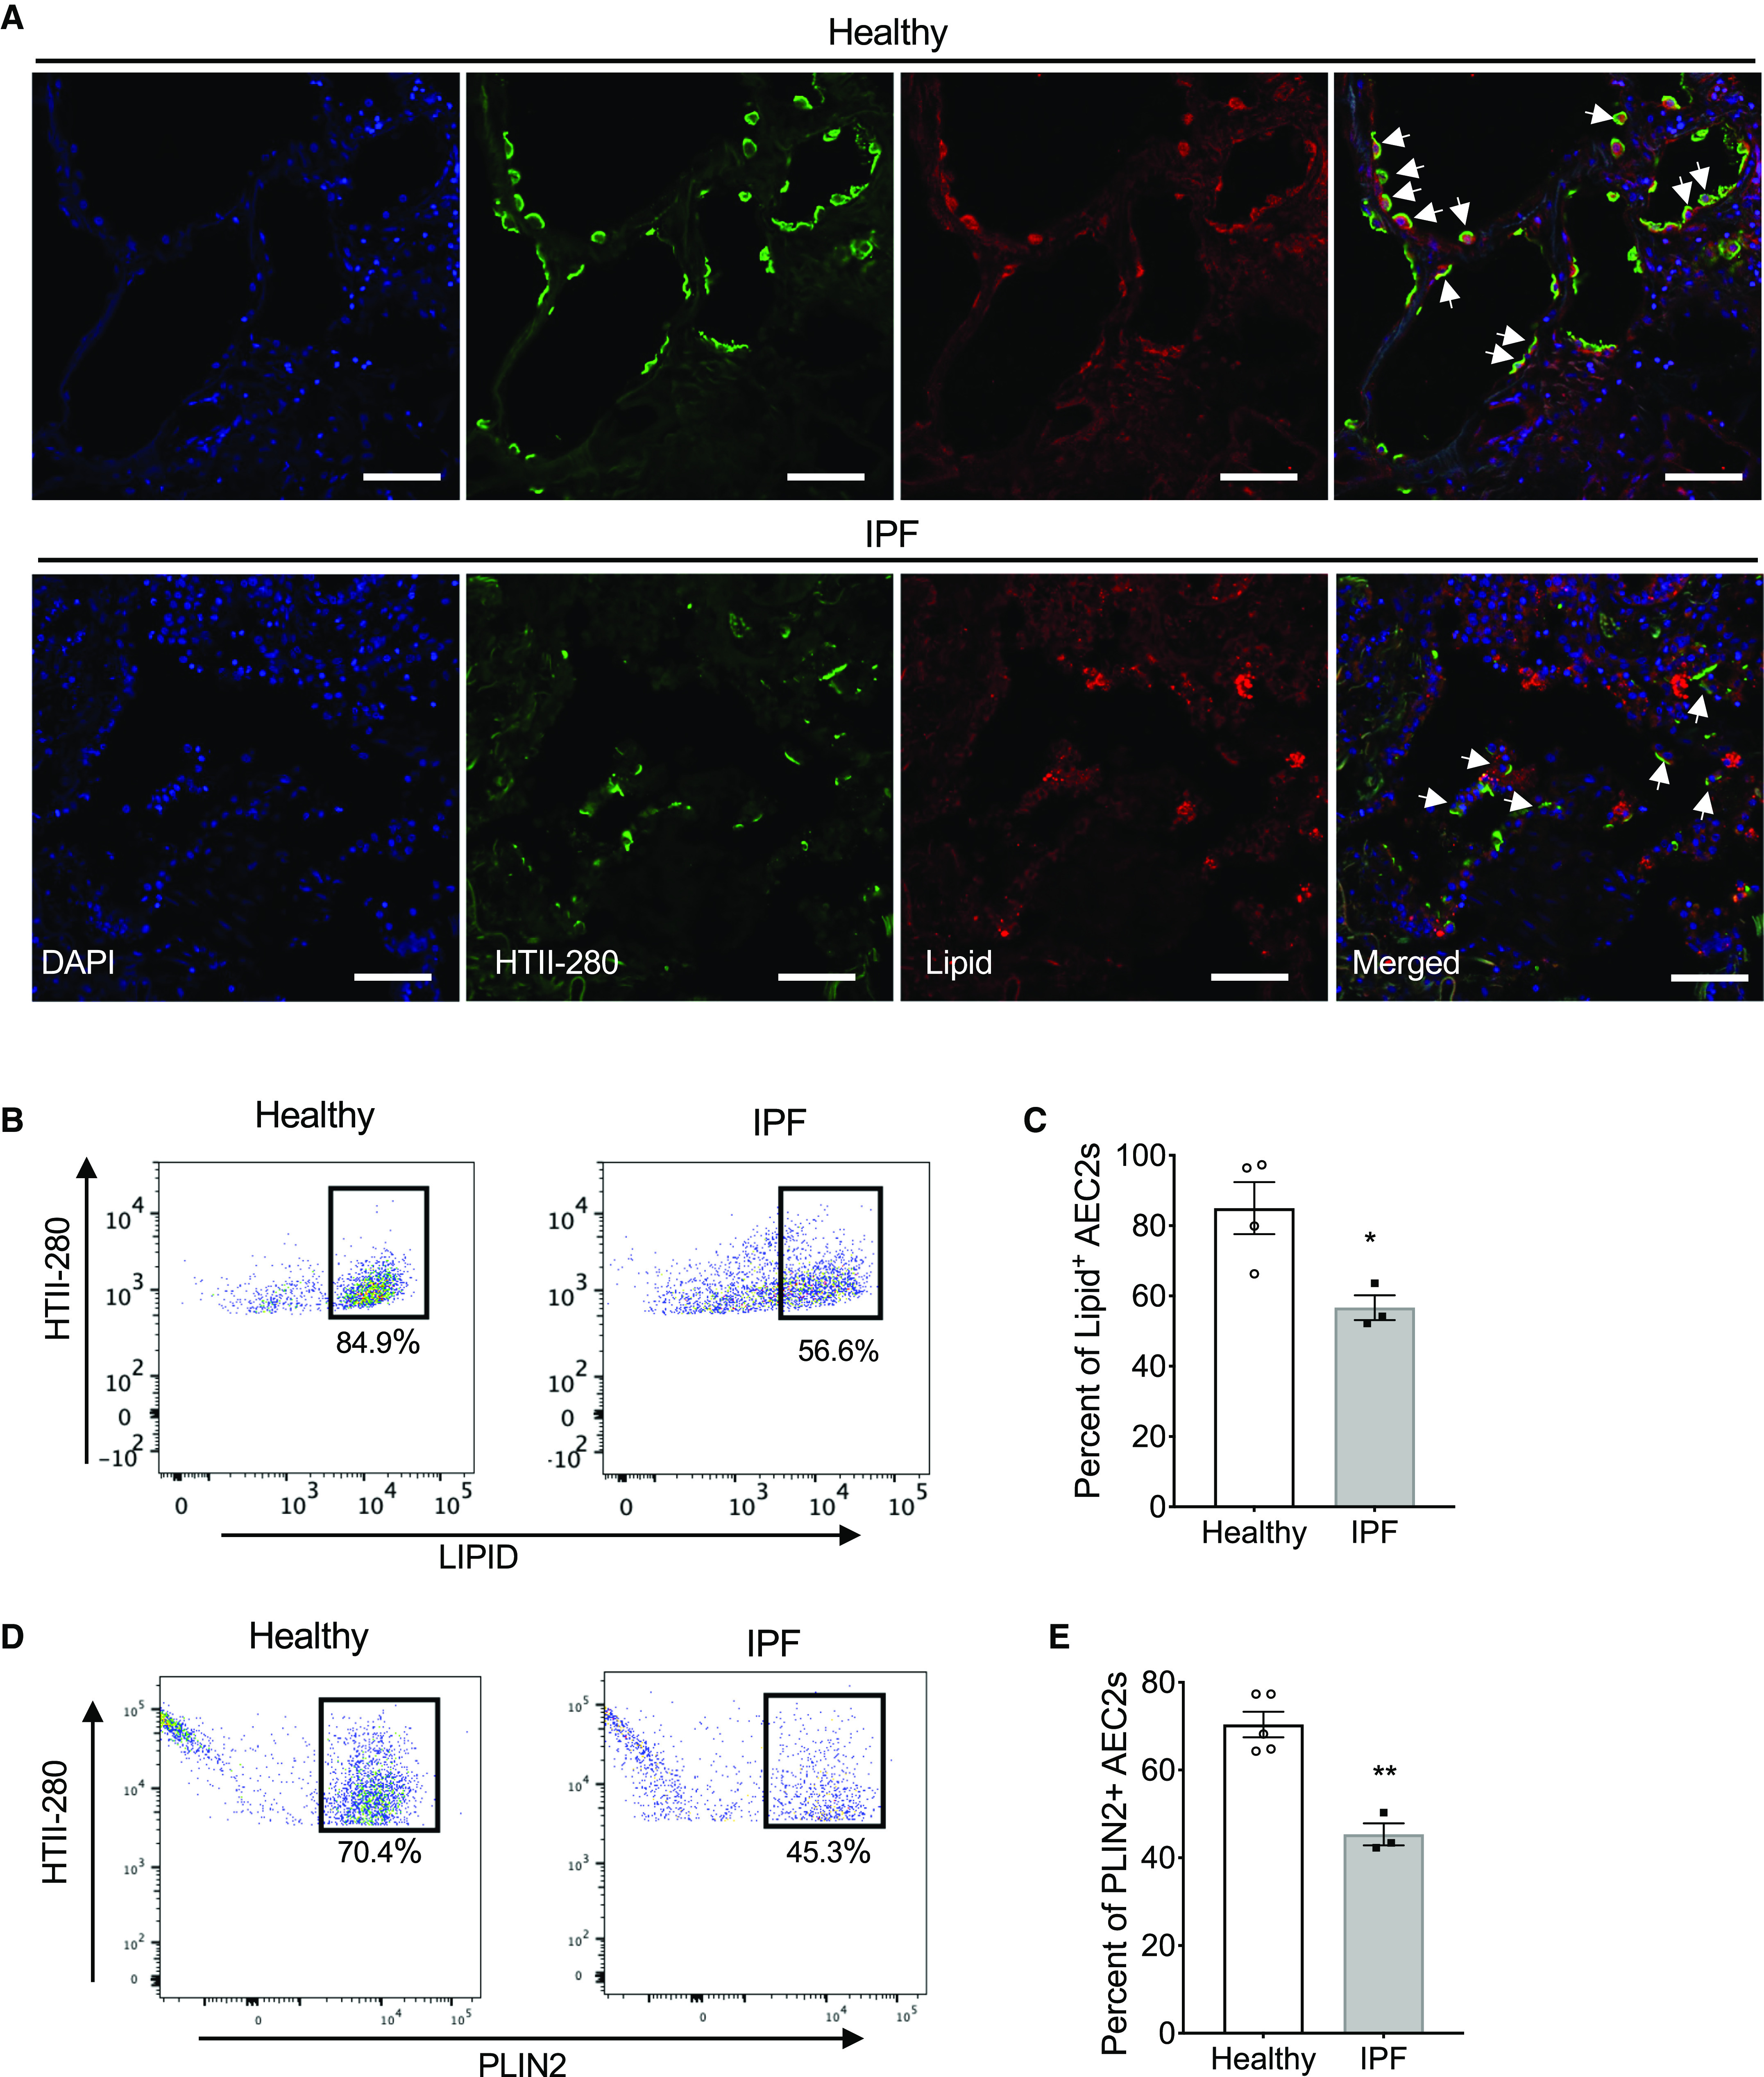
Decreased cellular lipid in AEC2s from lungs of patients with IPF. (A) Representative images of immunofluorescence costaining of HTII-280 and lipid, DAPI for nuclear staining, of lung sections from lung explants of patients with IPF and healthy donors (healthy, n = 3; IPF, n = 5). Arrows indicate AEC2s. Scale bars, 50 μm. (B–E) Flow cytometry analysis of AEC2s isolated from healthy and IPF lungs. Lipid staining (B) and the percentage of lipid+ cells in gated HTII-280+ AEC2s (C; n = 3–4; *P < 0.05 by unpaired Student’s t test). PLIN2 (perilipin 2) staining (D) and the percentage of PLIN2+ cells in gated HTII-280+ AEC2s (E; n = 3–5; **P < 0.01 by unpaired Student’s t test).