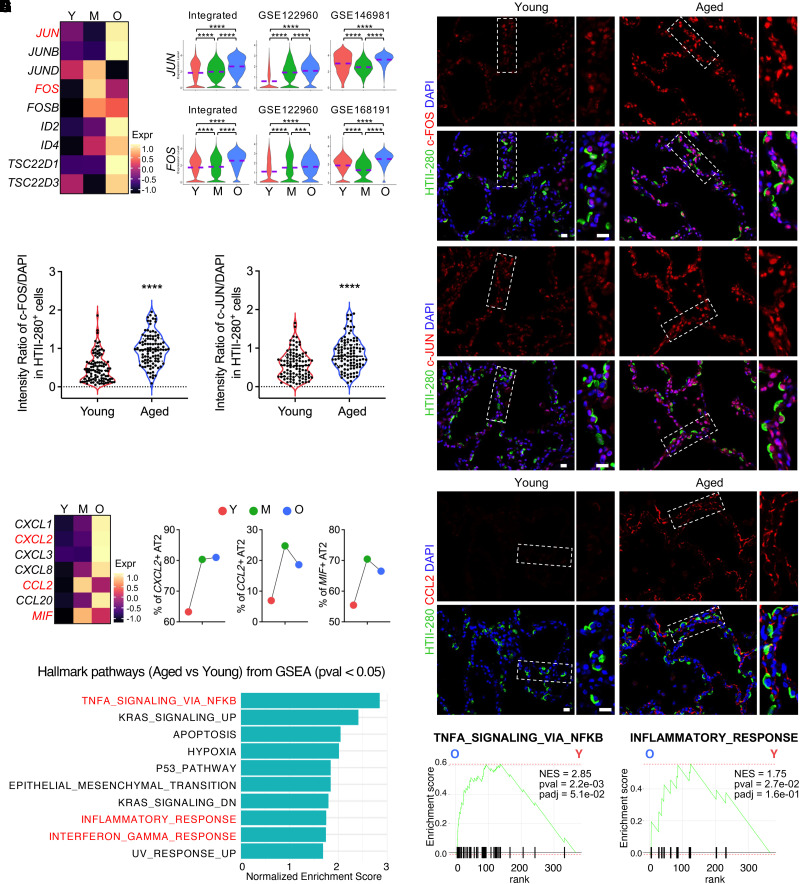
Figure 3.
Activated AP-1 (Activator Protein-1) and elevated inflammation in AT2 cells of aged human lungs. (A and B) Heatmap (A) and violin plot (B) visualization of the upregulated AP-1 transcriptional factor genes in aged AT2 cells in the integrated data and representative individual datasets. (C) Immunofluorescence staining presented the protein levels of representative AP-1 transcription factor gene, c-FOS (FOS) and c-JUN (JUN), in AT2 cells (HTII-280+) on human lung sections from young and aged donors. Boxed regions are magnified. (D) Quantified relative intensity ratios for c-FOS and c-JUN staining in AT2 cells (HTII-280+) compared with nuclear DAPI on human lung sections from young and aged donors (n = 100 cells from three subjects per group). (E) Heatmaps show the transcriptional levels of chemokine and cytokine genes in aged AT2 cells in the integrated data. (F) Percentage quantifications of AT2 cells positive for the representative chemokine and cytokine genes, CXCL2, CCL2, and MIF, in lungs from subjects of different age stages. (G) Immunofluorescence staining for the representative chemokine protein, CCL2, in alveolar regions on human lung sections from young and aged donors. Boxed regions are magnified. (H and I) Top canonical Hallmark pathways from GSEA (pval < 0.05) on genes upregulated in aged AT2 cells identified by Fast GSEA (FGSEA) are illustrated (H) and representative pathways are visualized by enrichment plots (I). Purple dashed lines in the violin plots indicate the mean levels of module score and gene transcriptions. Scale bars, 20 μm (C and G). ***P < 0.001 and ****P < 0.0001. GSEA = gene-set enrichment analysis; NES = normalized enrichment score.

