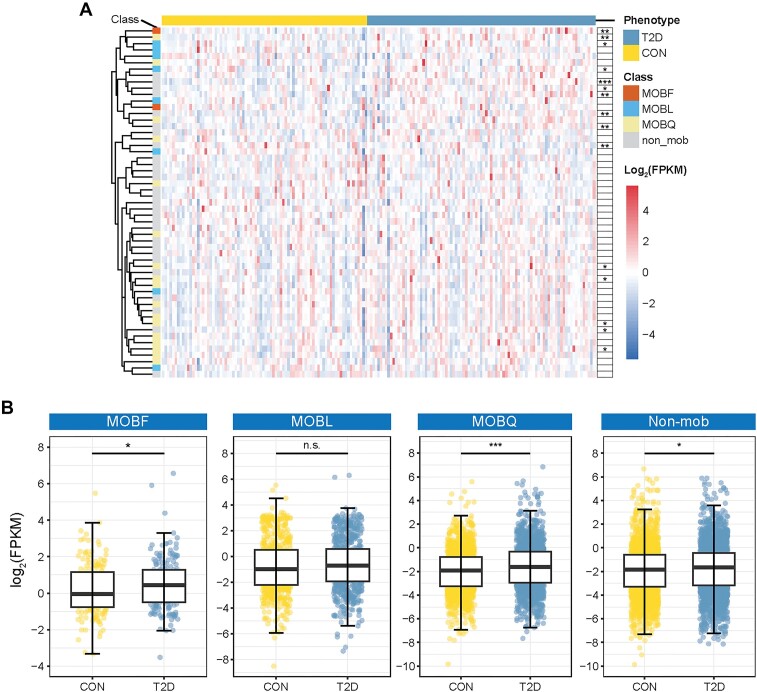
Figure 5:
Annotation of T2D-related plasmid bins using MOBFinder. (A) Heatmap of plasmid bins between T2D patients and controls. Each column represents a sample, and each row represents a plasmid bin. (B) Comparison of the abundance of the 4 identified MOB types between T2D patients and controls. The P value was calculated using the Wilcoxon rank-sum test, adjusted using the Benjamini–Hochberg method for multiple comparisons (*P-adjust < 0.05, **P-adjust < 0.01, and ***P-adjust < 0.001).

