Figure 3.
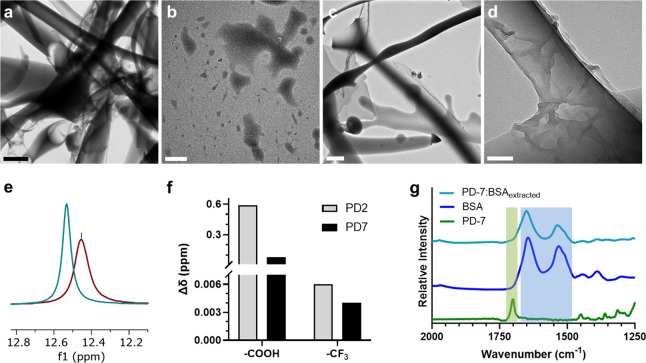
Mechanistic investigation of PD-7/protein interactions. (a, b) Transmission electron microscopic images of (a) BSA or (b) PD-7 in PFOc. Scale bar in panel a = 2 μm and panel b = 500 nm. (c) Transmission electron microscopy image of BSA dispersed with PD-7 in PFOc. Scale bar = 2 μm. (d) Magnified view of PD-7 coated BSA fibrils. Scale bar: 100 nm. (e) Superimposed 1H NMR region demonstrating the downfield shift of PD-7’s −COOH proton in the absence (maroon) and presence (teal) of BSA. (f) Change in 1H (−COOH) and 19F (−CF3) NMR chemical shift (Δδ) for PD-2 (gray) and PD-7 (black) following coordination with the BSA protein. (g) Stacked FTIR spectra of PD-7 (green), BSA (blue), and the PD-7/BSA complex after elution into PBS (teal). Green and blue shading highlights PD-7 and BSA specific spectral features, respectively.

