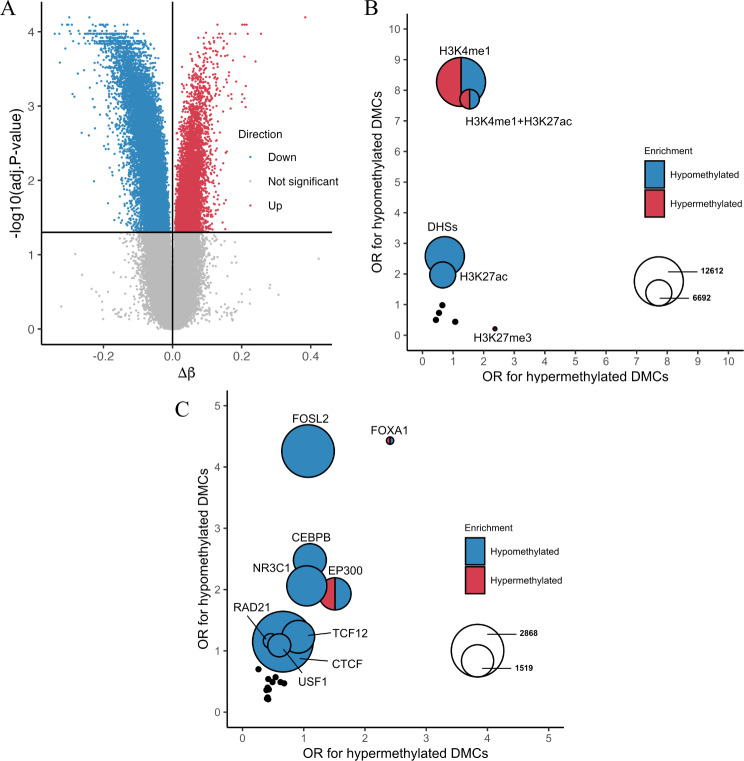
Fig. 2.
A Volcano plot showing the degree of methylation change (β-value difference [Δβ] from control) at each CpG site after 4 weeks of exposure to 30 µg/ml diesel exhaust particles (DEP) relative to the adjusted p-value. The horizontal and vertical black lines represent the adjusted p-value threshold at 0.05 and ∆β at 0, respectively. The adjusted p-values were calculated by differential methylation analysis between the control group (n = 4) and the 30 µg/ml DEP-treated group (n = 4). B Comparison of odds ratios (ORs) representing the degree of enrichment in genomic regions harboring epigenetic marks and CpG islands for each of hypomethylated or hypermethylated differentially methylated CpG sites (DMCs) after 4 weeks exposure to 30 µg/ml DEP. The color of the circle indicates which DMCs (hypomethylated or hypermethylated) are significantly enriched in the respective regions. The size of the circle corresponds to the total number of DMCs co-localized with the given enriched genomic region. C Comparison of ORs representing the degree of enrichment in transcription factor (TF) binding regions for each of the hypomethylated or hypermethylated DMCs after four weeks exposure to 30 µg/ml DEP. The color of the circle indicates which DMCs (hypomethylated or hypermethylated) significantly enriched in the respective regions. The size of the circle corresponds to the number of DMCs that overlap with the given enriched binding regions of TFs

