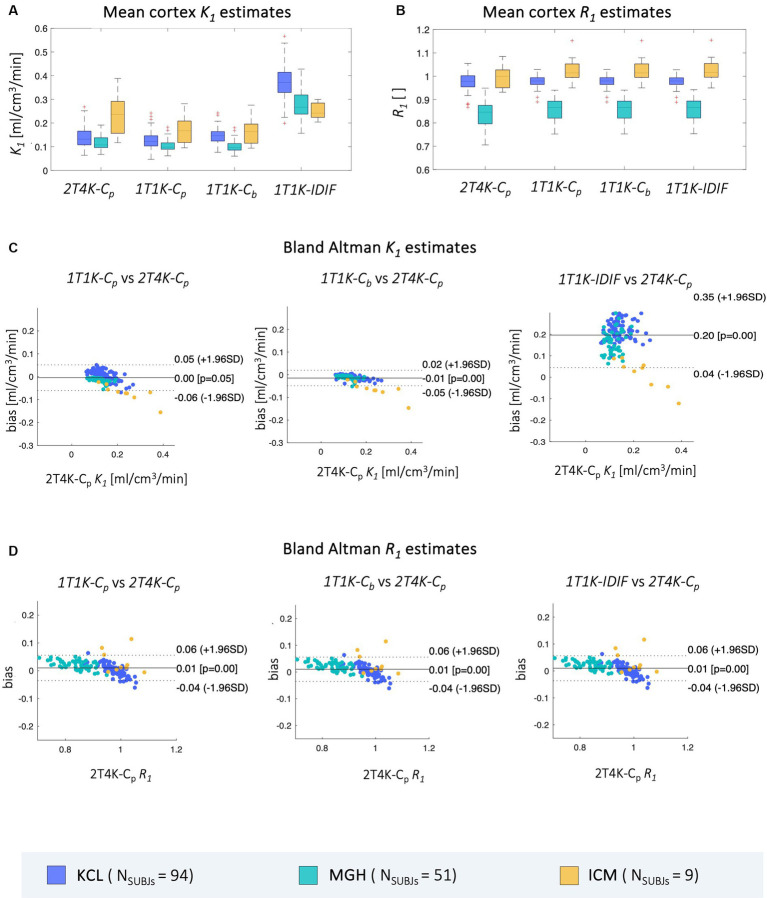
Figure 4.
Comparison of mean cortex K1 and R1 estimates. Panel A,B show, respectively, the distribution across subjects of mean cortex K1 and R1 estimates computed via each of the aforementioned methods (2T4K-Cp, 1T1K-Cp, 1T1K-Cb, 1T1K-IDIF); panel C,D show the Bland Altman plots for the comparison between the results of each of the reduced methodologies (1T1K-Cp, 1T1K-Cb, 1T1K-IDIF) and the standard-reference 2T4K-Cp estimates for K1 and R1 respectively; results are shown in different colors for the three PET centers (KCL, MGH, ICM).

