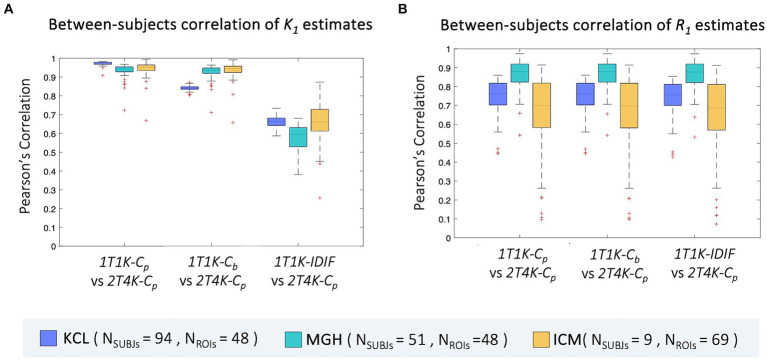
Figure 6.
Between-subjects correlation of ROIs K1 and R1 estimates. Panel A,B show, respectively for the ROIs K1 and R1 estimates, the distribution of the between-subjects Pearson’s correlation coefficients between each of the reduced models (1T1K-Cp, 1T1K-Cb, 1T1K-IDIF) and the full model (2T4K-Cp); results are shown in different colors for the three PET centers (KCL, MGH, ICM).

