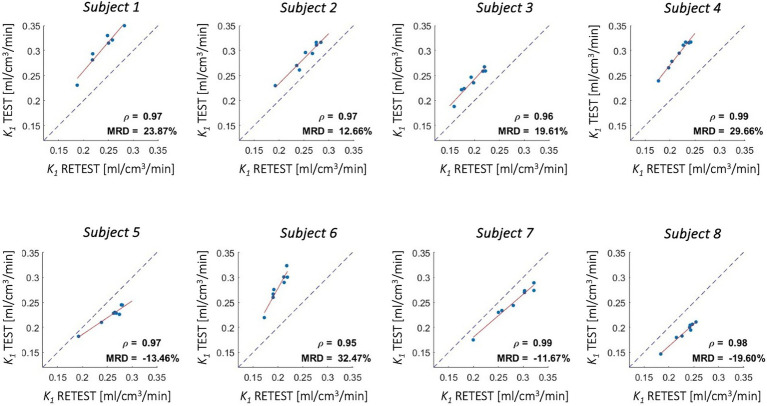
Figure 9.
Test–retest reproducibility of K1 estimates - [18F]DPA714 scans. Figure shows correlation between K1 estimates computed from test and retest scans for 4 cortical lobes, insula, cerebellum, thalami, and brainstem (red solid line: regression line; gray dotted line: identity line); Pearson’s correlation coefficient (ρ) and mean root distance (MRD) between test and retest estimates are reported in each panel.

