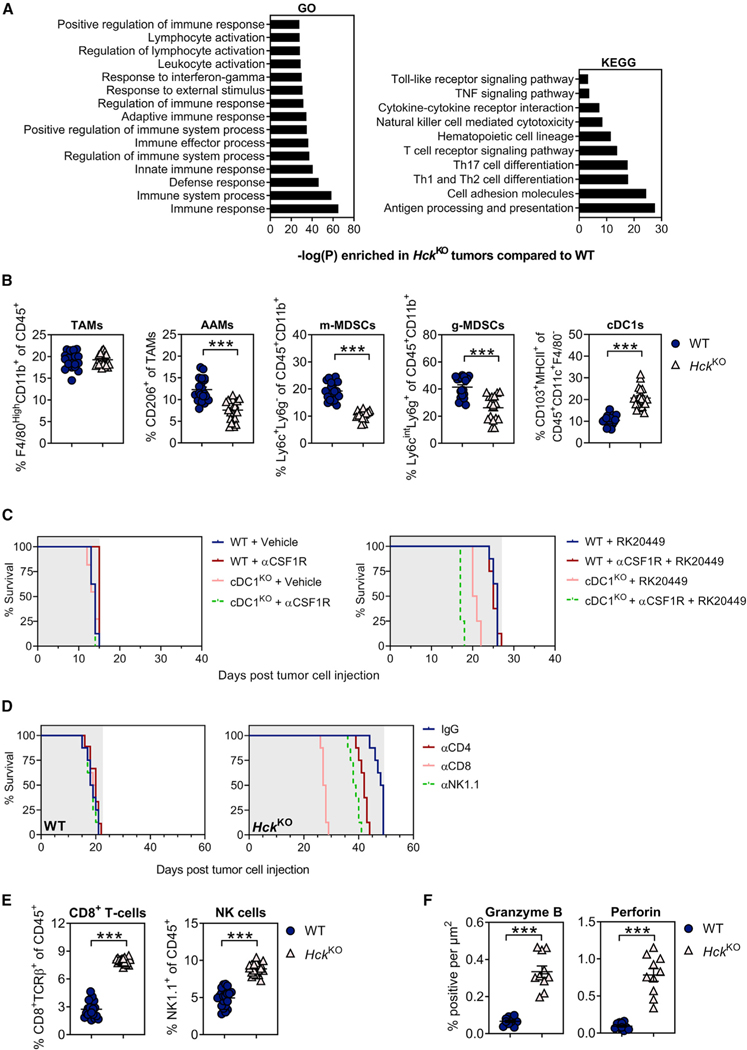
Figure 2. Genetic ablation of HCK in myeloid cells enhances cytotoxic effector cell recruitment and activation.
(A) Enriched KEGG and GO signaling pathways in KPC liver metastases of HckKO hosts compared with WT mice. n = 5 mice per group.
(B) Flow cytometry quantification of myeloid cells in KPC liver metastases of WT and HckKO hosts. Each symbol represents an individual mouse. n = 20 mice per group.
(C) Kaplan-Meier survival analysis of WT bone marrow chimeras reconstituted with cDC1-deficient (cDC1KO) or cDC1-proficient (WT) bone marrow. To deplete TAMs, half of each cohort were treated with αCSF1R prior to intrasplenic KPC tumor cell injection and continued until clinical endpoint. Following establishment of intrasplenic KPC tumors, mice were treated with the small molecule HCK inhibitor RK20449 or Captisol vehicle control. Shaded area indicates treatment period. n = 8 mice per group. A Mantel-Cox log rank test was used to evaluate statistical significance (see Table S3).
(D) Kaplan-Meier survival analysis of tumor-bearing WT and HckKO hosts following NK cell, CD4+ T cell, or CD8+ T cell depletion. Shaded area indicates treatment period. n = 8 mice per group. A Mantel-Cox log rank test was used to evaluate statistical significance (see Table S5).
(E) Flow cytometry quantification of CD8+ T cells and NK cells in KPC liver metastases of WT and HckKO hosts. Each symbol represents an individual mouse. n = 20 mice per group.
(F) Quantification of granzyme B and perforin immunohistochemical staining in KPC liver metastases of WT and HckKO hosts. Each symbol represents an individual mouse. n = 10 mice per group. Data represent mean ± SEM; ***p < 0.001, with statistical significance determined by an unpaired Student’s t test for comparison between two means. See also Figure S2 and Tables S3 and S5.

