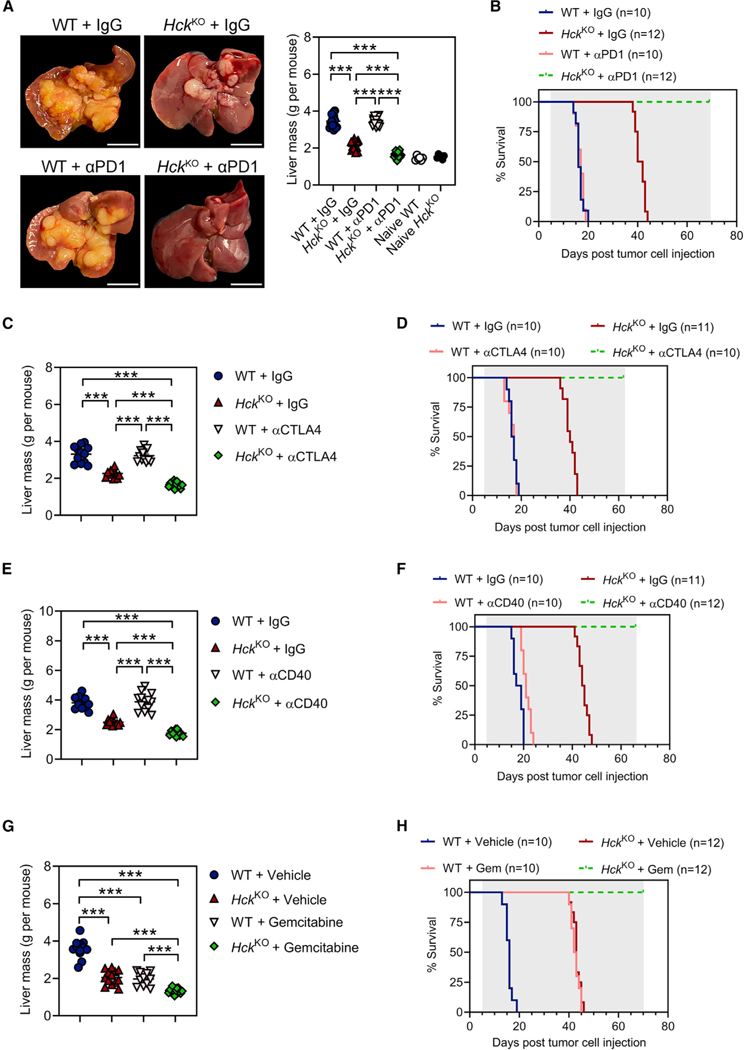
Figure 4. Genetic ablation of HCK in myeloid cells sensitizes PDAC tumors to immunotherapy and augments the efficacy of chemotherapy.
(A) Representative whole mounts and corresponding liver weights of WT and HckKO hosts treated once every 3 days with αPD1 or a matched IgG isotype control. Treatment commenced on the 5th day after intrasplenic KPC tumor cell injection and continued for 2 weeks. Scale bar: 1 cm. Each symbol represents an individual mouse. n ≥ 15 mice per treatment group, n = 6 mice per treatment naive group.
(B) Kaplan-Meier survival analysis of WT and HckKO hosts treated as described in Figure 4A until clinical endpoint. Shaded area indicates treatment period. n ≥ 10 mice per group. A Mantel-Cox log rank test was used to evaluate statistical significance (see Table S6).
(C and E) Liver weights of WT and HckKO hosts treated once every 3 days with (C) αCTLA4, (E) αCD40, or a matched IgG isotype control. Treatment commenced on the 5th day after intrasplenic KPC tumor cell injection and continued for 2 weeks. Each symbol represents an individual mouse. n ≥ 11 mice per group.
(D and F) Kaplan-Meier survival analysis of WT and HckKO hosts treated as described above with (D) αCTLA4, (F) αCD40, or a matched IgG isotype control until clinical endpoint. Shaded area indicates treatment period. n ≥ 10 mice per group. A Mantel-Cox log rank test was used to evaluate statistical significance (see Tables S7 and S8).
(G) Liver weights of WT and HckKO hosts treated weekly with gemcitabine or PBS vehicle. Treatment commenced on the 5th day after intrasplenic KPC tumor cell injection and continued for 2 weeks. Each symbol represents an individual mouse. n ≥ 11 mice group.
(H) Kaplan-Meier survival analysis of WT and HckKO mice treated as described in Figure 4G until clinical endpoint. Shaded area indicates treatment period. n ≥ 10 mice per group. A Mantel-Cox log rank test was used to evaluate statistical significance (see Table S9). Data represent mean ± SEM; ***p < 0.001, with statistical significance determined by one-way ANOVA followed by Tukey’s multiple comparison test or Mantel-Cox log rank test for Kaplan-Meier analysis. See also Figures S3 and S4 and Tables S6–S9.

