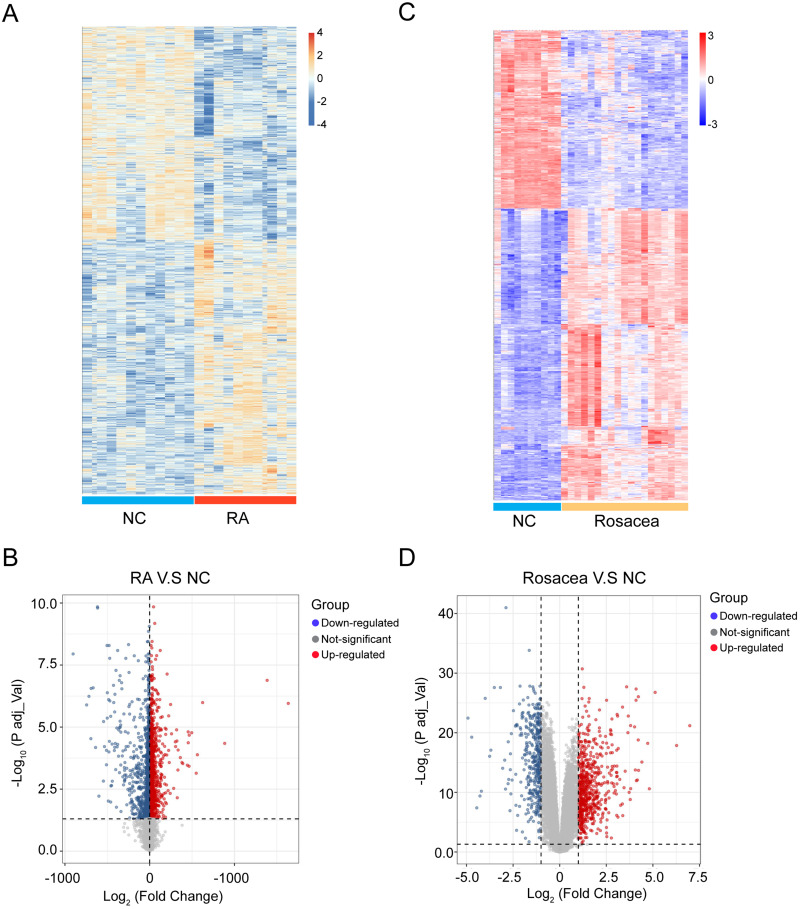
Figure 2.
Heatmap and volcano plot for the DEGs identified from the RA and rosacea datasets. (A) DEGs were showed in rows, and the samples of RA cases or controls were showed in columns. The Orange and blue represent DEGs with upregulated and downregulated gene expression, respectively. (B) Red, blue and gray plot dots represent DEGs in RA cases or control with upregulated, downregulated gene and not-significant expression, respectively. (C) DEGs were showed in rows, and the samples of rosacea cases or controls were showed in columns. The red and blue represent DEGs with upregulated and downregulated gene expression, respectively. (D) Red, blue and gray plot dots represent DEGs in rosacea cases or control with upregulated, downregulated gene and not-significant expression, respectively. NC, normal controls.

