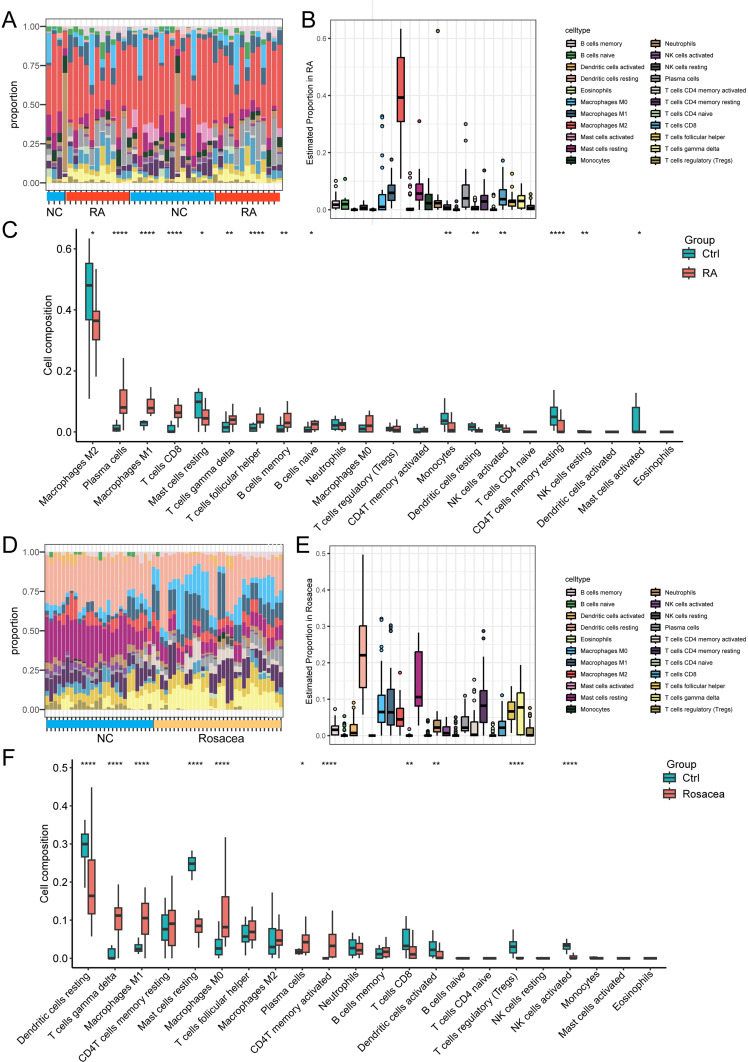
Figure 6.
The infiltration pattern of immune cells among different groups. (A) The relative percentage of 22 types of immune cells in RA datasets, and each column refers to one of the samples of RA cases or controls. (B) The relative percentage of 22 types of immune cells in all samples of RA databases. (C) The difference of immune infiltration between RA and controls. The control group was marked as blue color and RA group was marked as red color. (D) The relative percentage of 22 types of immune cells in RA datasets, and each column refers to one of the samples of rosacea cases or controls. (E) The relative percentage of 22 types of immune cells in all samples of rosacea databases. (F) The difference of immune infiltration between rosacea and controls. The control group was marked as blue color and rosacea group was marked as red color. *, p < 0.05; **, p < 0.01; ***, p < 0.001, ****, p < 0.0001. NC, normal controls.

