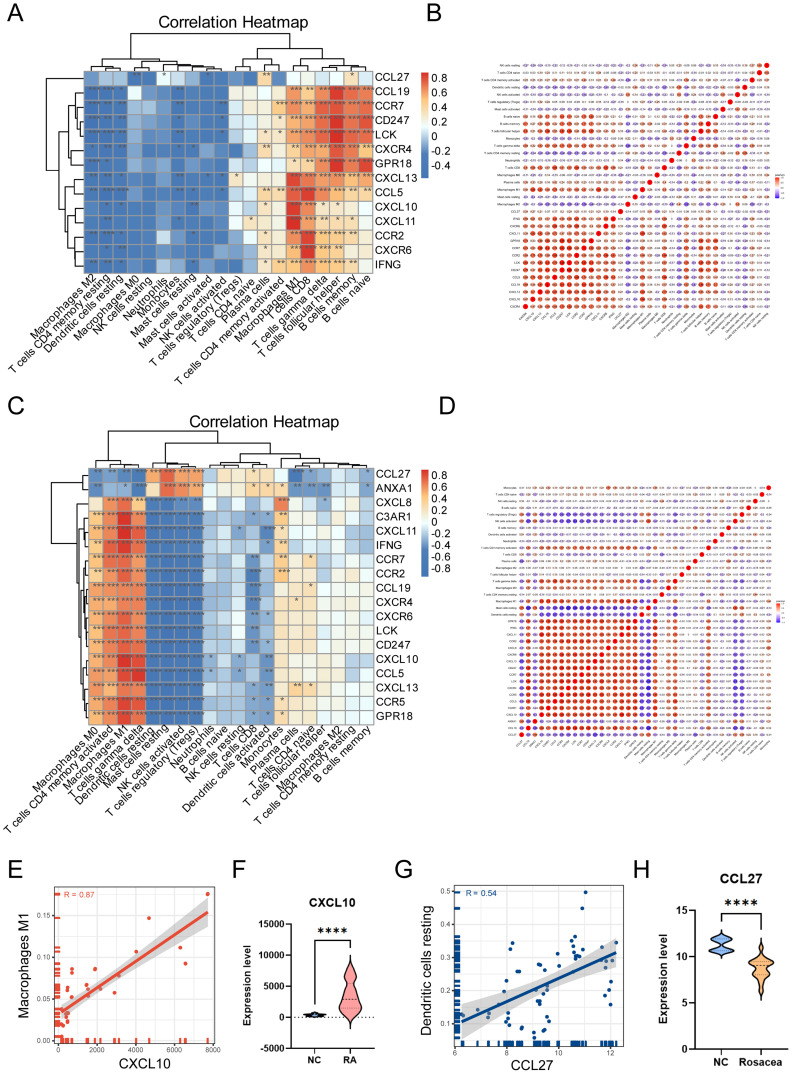
Figure 7.
The correlation between infiltrated immune cells and overlapped hub genes. (A) The heatmap showed the correlation between infiltrated immune cells and overlapped hub genes in RA. The darker the color, the stronger the correlation. Blue graph represents negative correlation, whereas red graph represents positive correlation between infiltrated immune cells and overlapped hub genes. (B) The babble plot showed correlation coefficients (R) among each kind of infiltrated immune cells and every single overlapped hub gene in RA. (C) The heatmap showed the correlation between infiltrated immune cells and overlapped hub genes in rosacea. The darker the color, the stronger the correlation. Blue graph represents negative correlation, whereas red graph represents positive correlation between infiltrated immune cells and overlapped hub genes. (D) The babble plot showed correlation coefficients (R) among each kind of infiltrated immune cells and every single overlapped hub gene in rosacea. (E) The correlation between CXCL10 and M1 macrophages in RA. (F) The expression level of CXCL10 in RA and control. (G) The correlation between CCL27 and dendritic cells resting in rosacea. (H) The expression level of CCL27 in rosacea and control. Data are presented as the mean ± standard error of the mean. Statistical significance (Student’s t-test): *, p < 0.05; **, p < 0.01; ***, p < 0.001. NC, normal controls.

