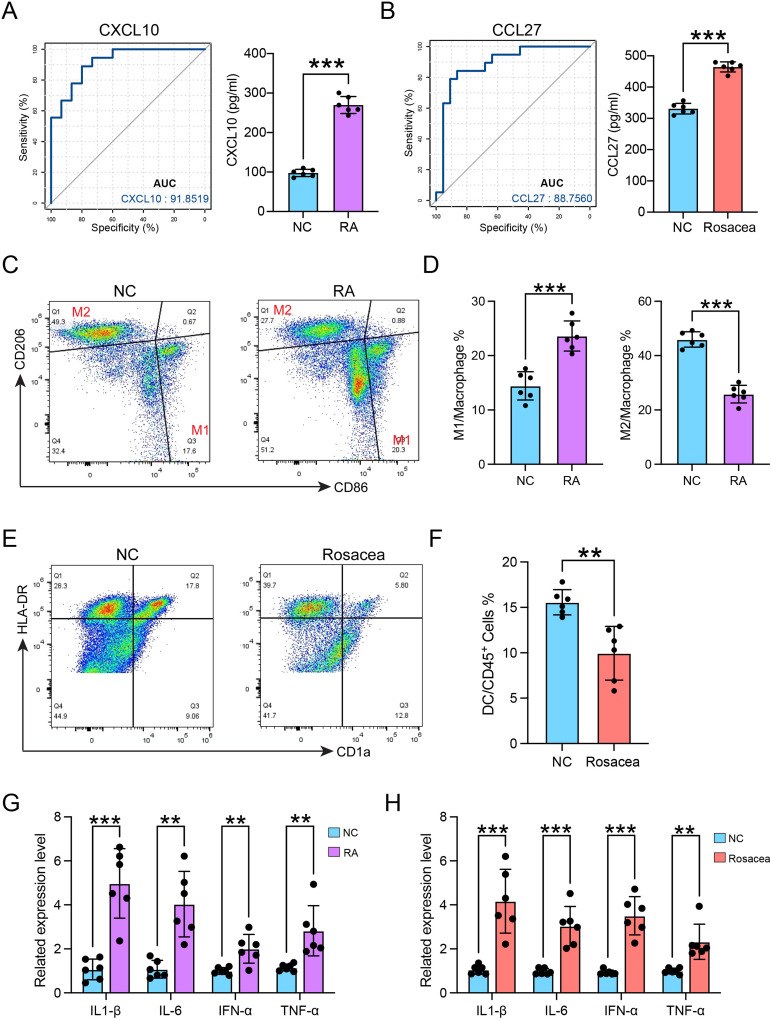
Figure 8.
The validation of infiltrated immune cells and diagnostic biomarkers. (A) The diagnostic effectiveness of CXCL10 for RA by ROC analysis (left), and the serum CXCL10 concentration in patients of RA (right). (B) The diagnostic effectiveness of CCL27 for RA by ROC analysis (left), and the serum CCL27 concentration in patients of rosacea (right). (C) The gating strategy for identifying M1 macrophages and M2 macrophages from CD45+ cells. (D) The quantitative analysis of the proportions of M1 and M2 macrophages in control and patients with RA (n=6). (E) The gating strategy for identifying DC cells from CD45+ cells. (F) The quantitative analysis of the proportions of DC cells in control and patients (n=6) with rosacea. (G) The mRNA expression levels of TNF-α, IL-6, IL-1β, and IFN-α in macrophages separated from patients with RA or normal control (NC) after CXCL10 treatment for 24h. (H) The mRNA expression levels of TNF-α, IL-6, IL-1β, and IFN-α in DC cells separated from patients with rosacea or normal control (NC) after CCL27 treatment for 24h. Data are presented as the mean ± standard error of the mean. Statistical significance (Student’s t-test): **p < 0.01, ***p < 0.001. NC, normal controls.

