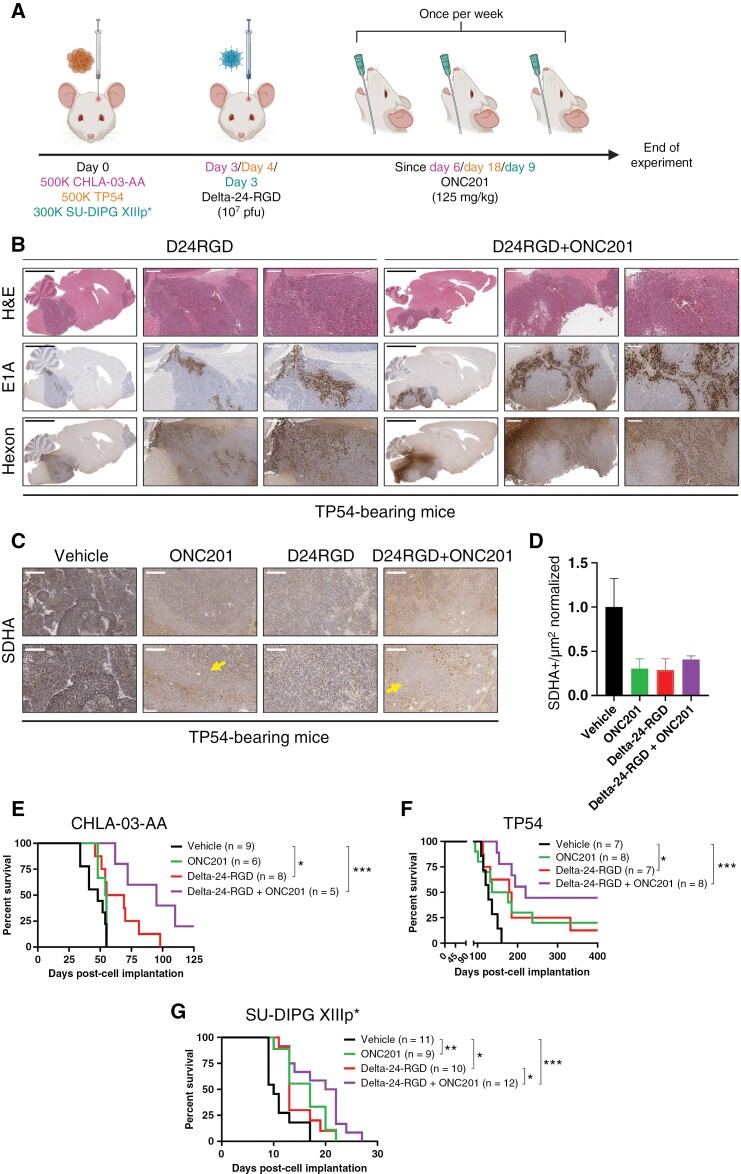
Figure 3.
(A) Treatment schedule for immunosuppressed, human orthotopic-bearing mouse models (CHLA-03-AA, TP54, and SU-DIPG-XIIIp*). (B) Representative immunostaining images of brain samples from TP54-bearing mice at the sacrifice time. H&E was used to confirm tumor presence, and E1A and Hexon were used as adenovirus markers. Scale bars: 3 mm, 500 µm and 250 µm. (C) Representative images of SDHA staining from TP54-bearing mice at the sacrifice time. Scale bars: 300 µm (upper panels), and 150 µm (bottom panels). D. Quantification of SDHA staining in TP54-bearing mice and represented as SDHA+/µm2 normalized ratio. Arrows indicate regions without SDHA staining. Scale bar: 200 µm. (E), (F) and (G). Survival curve analysis after cell implantation following the sacrifice of CHLA-03-AA (E), TP54 (F), and SU-DIPG-XIIIp*(G)-bearing mice. The log-rank (Mantel–Cox) test was performed for statistical analysis. The numbers of mice in each group appear in brackets. *P < .05, **P < .01, ***P < .001.

