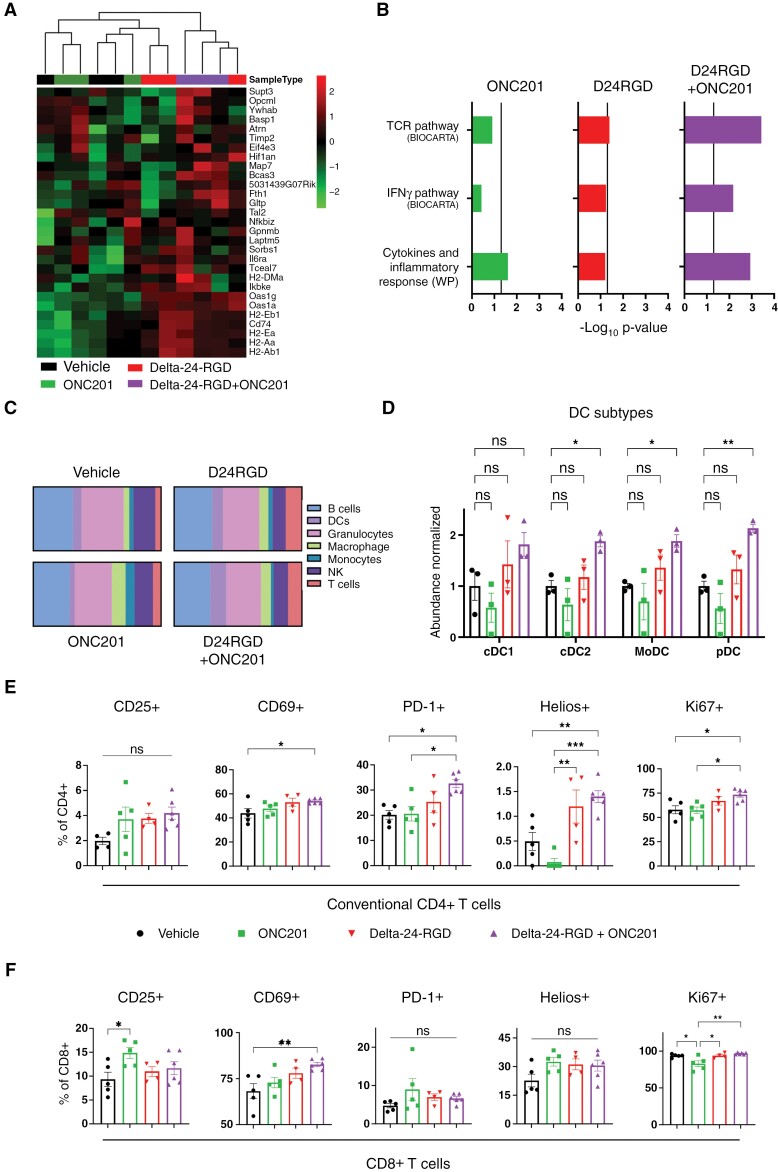
Figure 6.
(A) Heatmap and hierarchical clustering represent the differential expression in genes that are downregulated in glioma stem cells and upregulated in oligodendrocyte differentiation.42,43 Transcriptomic data were obtained from XFM-bearing mice tumors after 7 days of each treatment. Three mice were included per group. (B) GSEA of transcriptomic signatures in treated XFM-bearing mice tumors compared with vehicle-bearing mice. Vertical line indicates statistical significance (−Log10 0.05). (C) Relative abundances (in percentages) of the different immune populations were determined by analysis of RNAseq data through the online tool ImmuCellAI-mouse.45 (D) Normalized abundance of type-1 and 2 conventional DCs (cDC1/2), monocyte-derived DCs (moDC), and plasmacytoid DCs (pDC). E and F. Percentage of positive populations of the indicated markers in conventional CD4+ T cells (E) and CD8+ cells (F). Immune cells were analyzed 7 days after each treatment in XFM-bearing mice and measured by flow cytometry. For D, E, and F, data are shown as the mean ± SEM, and at least 3 animals were included per group. One-way ANOVA was performed for statistical analysis. *P < .05, **P < .01, ***P < .001, ns, not significant.

