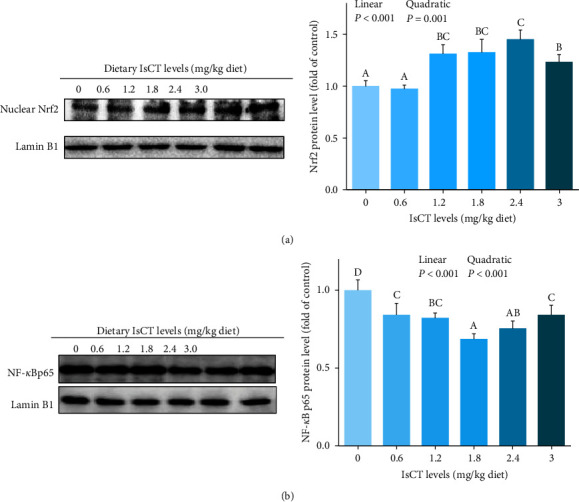
Figure 4.

The related protein expression (a) Nrf2 and (b) NF-κBp65 in the gill of grass carp fed with IsCT for 60 days and infected with F. columnare. Values are means ± SD, n = 6 (six fish in each group). Different letters indicate significant differences (P < 0.05). P values indicate a significant linear or quadratic dose–response relationship (P < 0.05).
