Figure 9.

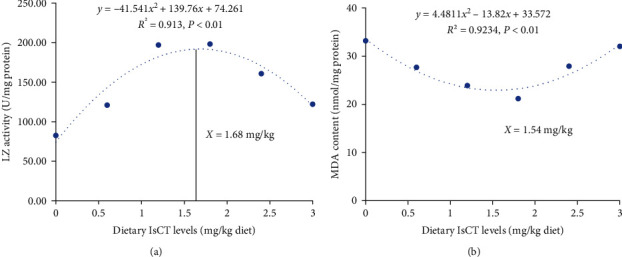
Quadratic regression analysis of LZ activities (a) and MDA content (b) for grass carp fed diets containing various IsCT levels for 10 weeks. LZ, Lysozyme; MDA, malondialdehyde.

Quadratic regression analysis of LZ activities (a) and MDA content (b) for grass carp fed diets containing various IsCT levels for 10 weeks. LZ, Lysozyme; MDA, malondialdehyde.