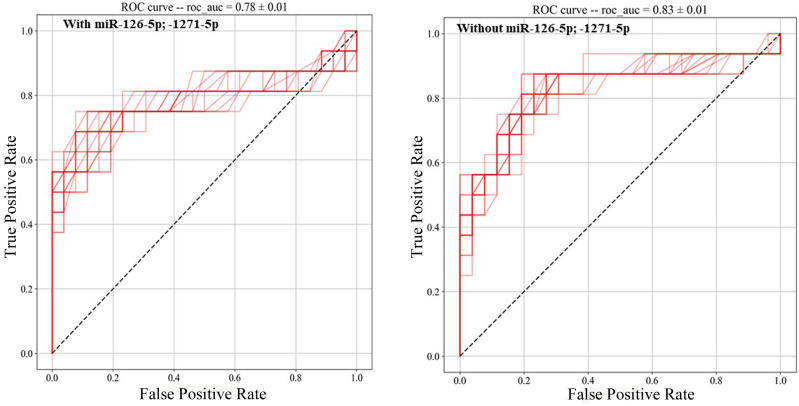
Figure 3.
ROC analyses with the model: CXCL9, % of monocytes, albumin, CRP, with and without miR-126–5p and miR-1271–5p. ROC analyses were obtained with a machine learning-based approach (see Methods). A 10× repetition of the analyses resulted in the SD calculation and p-values. The model with CXCL9 and without the identified miRs resulted in the most significant one (AUC = 0.83, 95% c.i. [0.85, 0.81], p = 0.0028).

