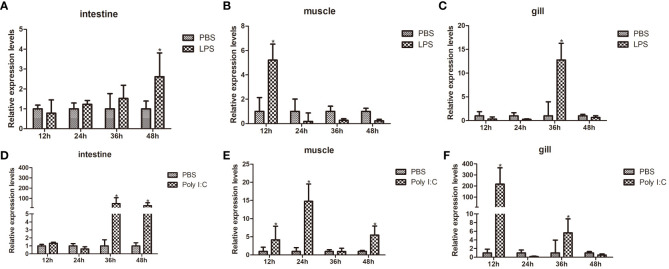
Figure 5.
Time course expression patterns of PcFerH gene analyzed by qRT-PCR. (A-C) represented the expression profiles in intestines, muscles, and gills at different time points after LPS challenge. (D-F) represented the expression profiles in intestines, muscles, and gills at different time points after challenge with Poly I:C. All experimental groups were treated with PBS-injection group as the control group. And 18S RNA gene was used as the inner control. The as-terisks indicated significant differences (*P < 0.05) from the control.

