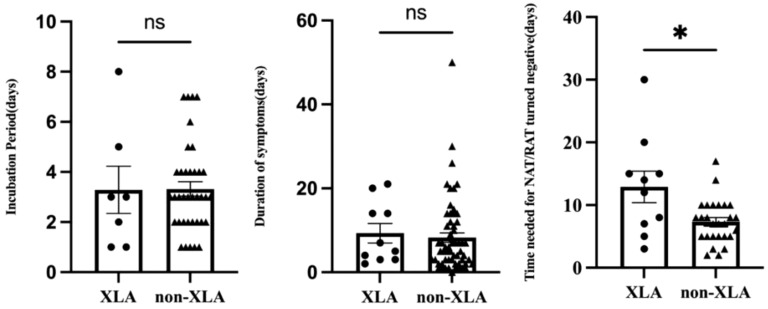
Figure 1.
Comparison of the incubation period, duration of symptoms, and time of NAT/RAT conversion to negative between children with XLA and other IEI diseases (non-XLA). In each graph, the dots denote each of the numerical values, the middle long lines denote the mean, and bilateral short lines denote the standard error of the mean. *p=0.0362.

