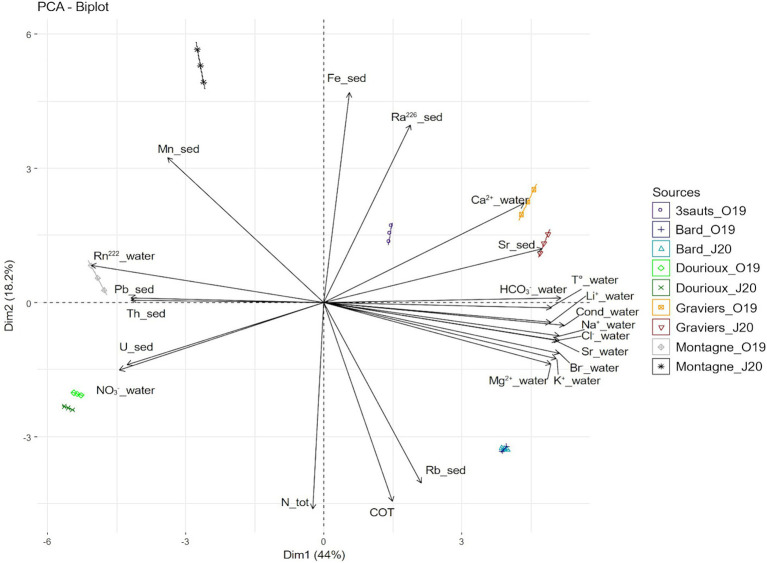
Figure 2.
Principal component analysis (PCA) showing the distribution of the springs sampled in October 2019 and June 2020 (except for 3 sauts: no data for June 2020). The analysis is based on 23 physical and chemical variables that significantly contribute to explaining this distribution. The first two axes explain 62.25% of the variance (44.03% for the first axis and 18.22% for the second axis).

