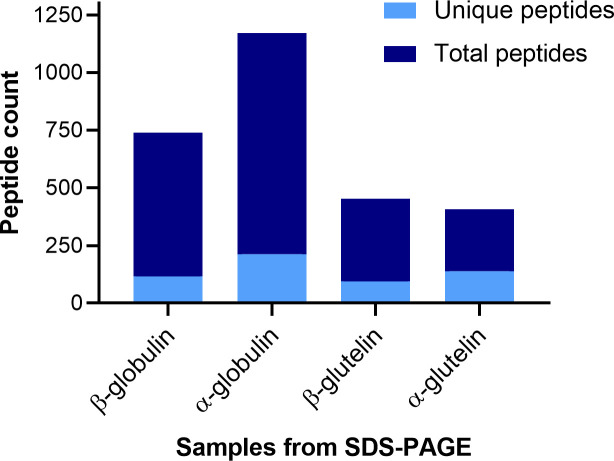
Figure 4.
Stacked bar graph of the peptides identified by MSMS from the SDS-PAGE band samples. Representation of the count of total peptides, and the non-duplicated ones (unique), that were identified in each of the protein-containing samples by LC-MSMS (y-axis). The samples refer to protein bands in SDS-PAGE gels: firstly, the globulin subunit that is found at each MW (β or α) and then the gel lane from which the sample was cut (globulin or glutelin).

