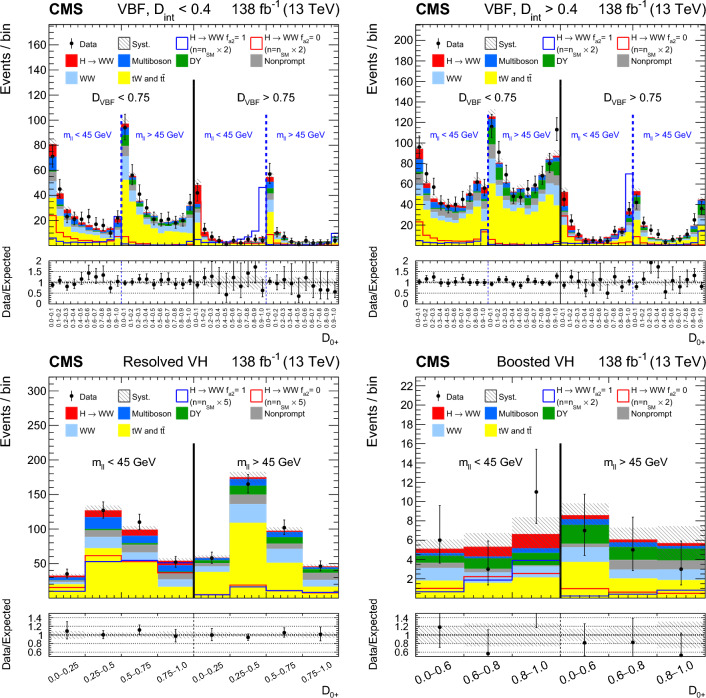
Fig. 3.
Observed and predicted distributions after fitting the data for in the VBF channel (upper), and for in the Resolved VH (lower left) and Boosted VH (lower right) channels. For the VBF channel, the (left) and (right) categories are shown. The predicted Higgs boson signal is shown stacked on top of the background distributions. For the fit, the and HVV coupling contributions are included. The corresponding pure and signal hypotheses are also shown superimposed, their yields correspond to the predicted number of SM signal events scaled by an arbitrary factor to improve visibility. The uncertainty band corresponds to the total systematic uncertainty. The lower panel in each figure shows the ratio of the number of events observed to the total prediction

