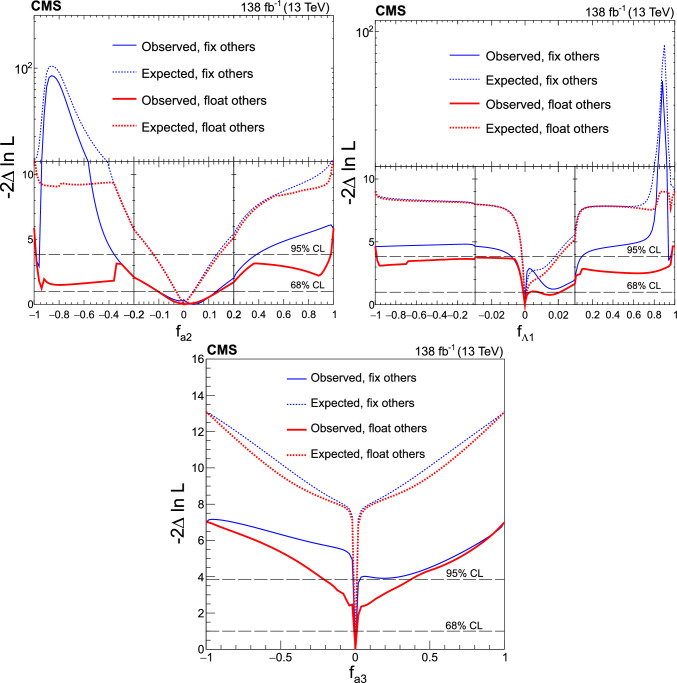
Fig. 9.
Expected (dashed) and observed (solid) profiled likelihood on (upper left), (upper right) and (bottom) using Approach 2. The other two anomalous coupling cross section fractions are either fixed to zero (blue) or left floating in the fit (red). In each case, the signal strength modifiers are treated as free parameters. The dashed horizontal lines show the 68 and 95% regions. Axis scales are varied for and to improve the visibility of important features

