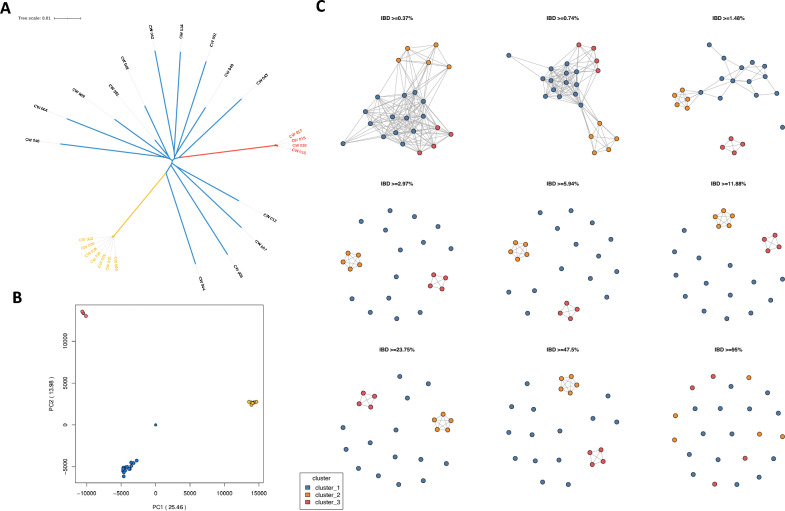
Figure 1.
Population structure of P. falciparum isolates from highland epidemic outbreaks in Western Kenya. (A) Maximum likelihood tree of 30 isolates from Western Kenya (284,667 genome-wide SNPs). (B) PCA of the genetic pairwise matrix used to generate the maximum likelihood tree, with clusters coloured accordingly. (C) Pairwise identity-by-descent (IBD) connectivity plots between clusters, highlighting high levels of IBD (IBD > 47.5%) between clusters in Western Kenya.

